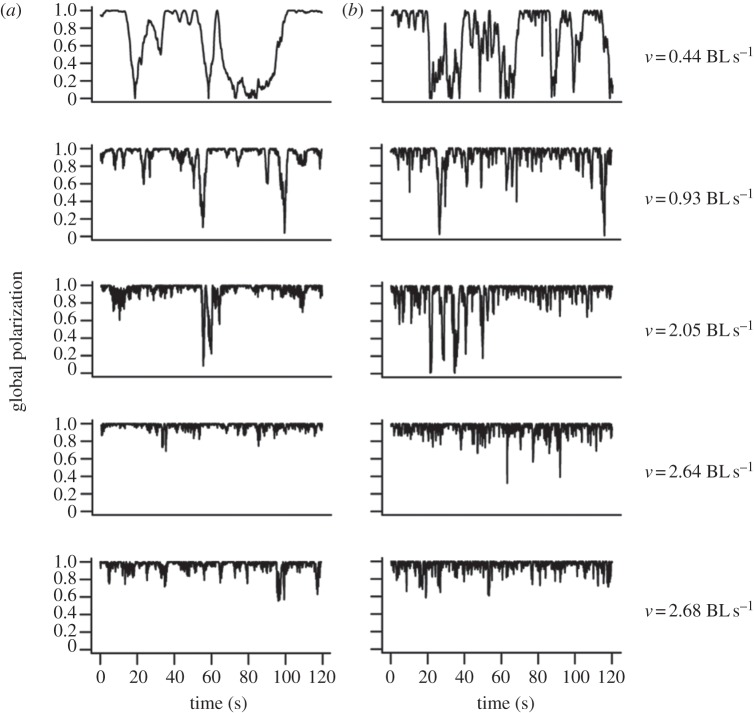
Figure 3.
(a) Time series of the alignment between two fish (left) for each experiment and (b) corresponding model simulations (right), ordered by increasing fish speed. Speed is expressed in fish body lengths per second. The speed and polarization interrelation is captured through speed dependency of the model's coefficient (text and figure from [40]).

