
Figure 4.
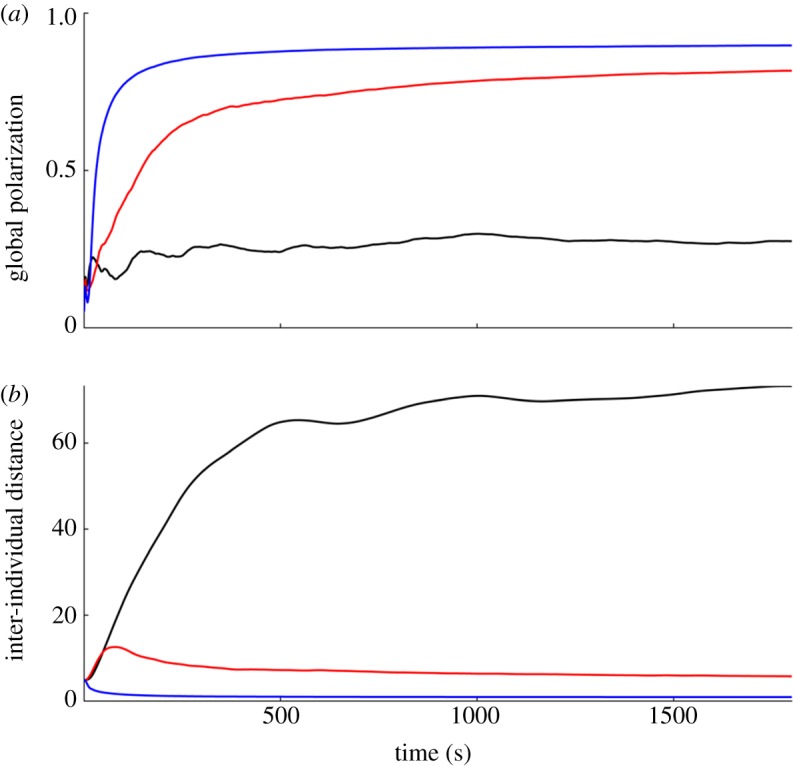
Impact of various neighbourhoods on group polarization and inter-individual distances in a simulated fish-school model. Simulations are from Gautrais et al. model [40] with a speed of 0.54 body length per second and parameters fitted from data on groups of 10 fish. We simulated a school of 100 fish for half an hour in a 100 m diameter arena. Initial orientations of fish are randomly chosen and their initial positions are randomly distributed within a circle of 30 m diameter in the centre of the arena. (a) Global polarization of the school for various definition of the neighbourhood. Blue line denotes all fish are considered within a 4 m range. Red line denotes only the fish that belongs to the first shell in a Voronoi tessellation are considered. Black line denotes only the seven nearest neighbours are considered. (b) Mean inter-individual distance between fish. The drop in global polarization and the large inter-individual distances observed when the seven nearest neighbours are considered are due to the split of the school.