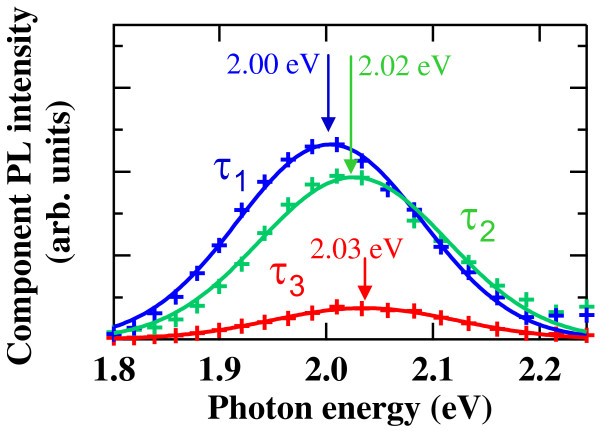
Figure 3.
Decay-associated PL spectra. The spectra were obtained from the global fit analysis with linked time constants of a triple exponential function expressing the PL decay curve. Solid lines show fitting curves using Gaussian functions. A peak energy for each PL component is also indicated by an arrow.

