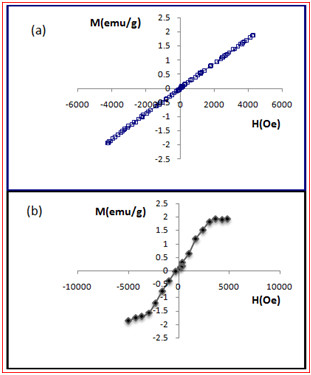
Figure 5.

Magnetometry graphs for SPGOand Gd2O3-DEG. Graphs of (a) SPGO and (b) Gd2O3-DEG magnetization (emu/g) plotted as a function of applied field (Oe). VSM magnetometry shows paramagnetic behavior of SPGO. Also, magnetization curve with S shape (sigmoidal) of Gd2O3-DEG nanoparticle is shown in (b) is similar to superparamagnetic materials.
