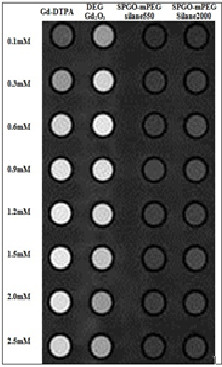
Figure 6.

Arrangement of nanoparticle tubesfor imaging and relaxometry. Signal intensities for Gd2O3-DEG were more than Gd-DTPA and two other nanoparticles. The quantitative variation results of signal intensities in Figure 8b are in complete accordance with the image visualization in relation to in vitro dilutions of the three materials. Signal intensities displayed a relatively steep increase when approaching a more gradual increase, thereafter.
