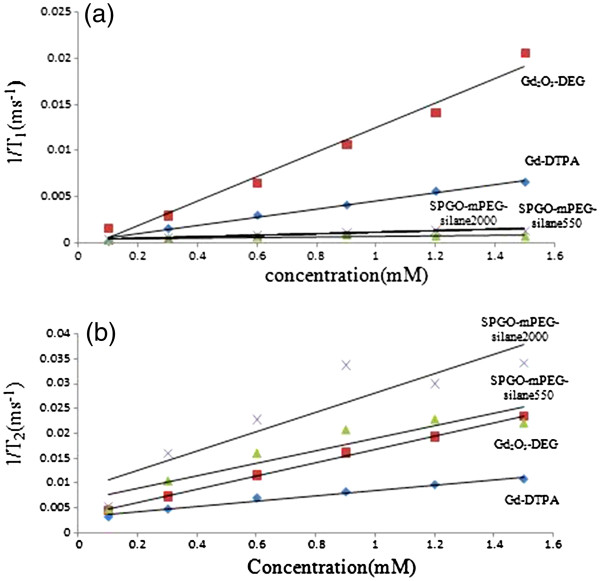
Figure 7.

Longitudinal(R1)(a)and transversal(R2)(b)relaxation rates vs. concentration. The slope of the curve or relaxivity (r1 and r2) was obtained for Gd-DTPA (diamond), Gd2O3-DEG (square), SPGO-mPEG-silane550 (triangle), and SPGO-mPEG-silane2000 (cross). The solid lines represent the linear regression of the data. Gd2O3-DEG had longitudinal proton relaxivity at least 2.5 times higher than Gd-DTPA, whereas r1 for SPGO-mPEG-silane550 and 2000 was less compared with Gd-DTPA.
