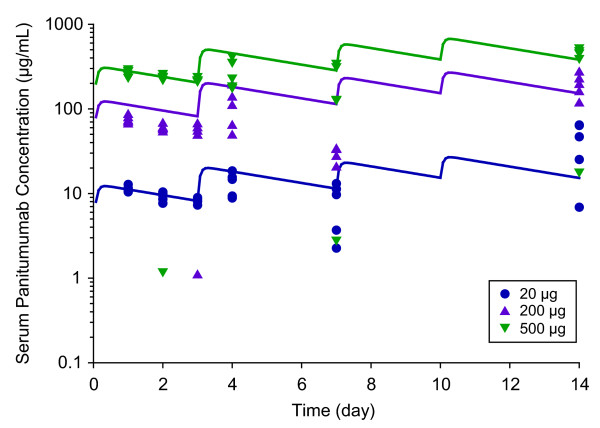
Figure 2.
The observed and modeled panitumumab PK profiles in xenograft mice after intraperitoneal administration of panitumumab twice a week. Serum concentrations of panitumumab were assessed 1, 2, 3, 4, 7, and 14 days after the first dose (symbols, n = 5/time point); lines represent modeled pharmacokinetic profiles.

