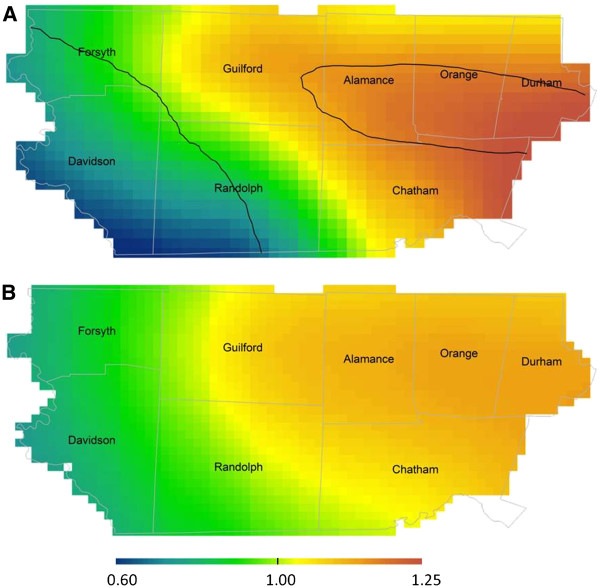
Figure 2.

Geographic distribution of ASD prevalence relative to the birth cohort n=11,034 and ASD n=532: Unadjusted (A) and fully adjusted models (B) are presented using the optimal span size of each (0.75 and 0.95 respectively). The unadjusted model is significantly different than flat (global P=0.003). Areas of significantly increased and decreased prevalence are indicated by black contour bands. Adjusted model is not significantly different than flat (global P=0.052). Adjustment factors were year of birth; plurality; maternal age, race, and level of education; and report of tobacco use during pregnancy.
