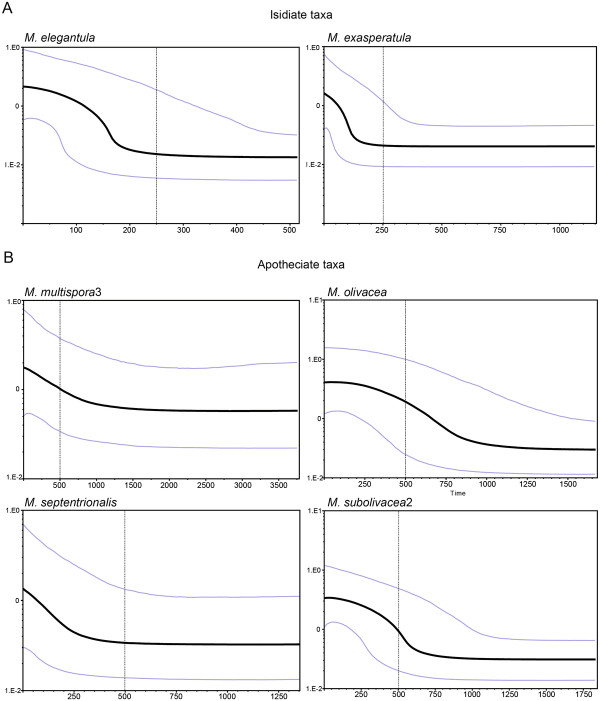
Figure 3.
Bayesian skyline plots for (A) two Melanohalea species commonly propagating via vegetative diaspores (M. elegantula and M. exasperatula ) and (B) four sexually reproducing lineages (M. multispora 3, M. olivacea , M. septentrionalis , and M. subolivacea 2). The solid black line represents the median value for the log of the population size (log Ne) and the grey lines represent the upper and lower 95% credible intervals. The x-axis measures times in thousands of years. Generation times are not known for Melanohalea species and population sizes (y-axis) only represent relative changes.

