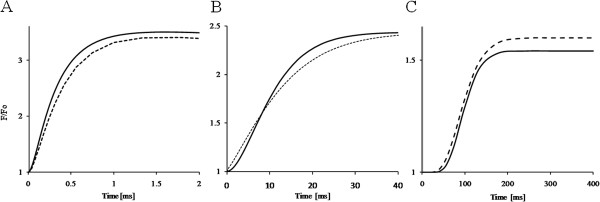
Figure 10.
Analysis of OJDIP kinetics curves. Time courses of the release of photochemical (A), photoelectrochemical (B) quenching and of photoelectric fluorescence stimulation (C), respectively in dark-adapted pea (solid lines) and bean leaves (dashed lines) calculated with fluorescence induction algorithm. Curves are on a linear time scale.

