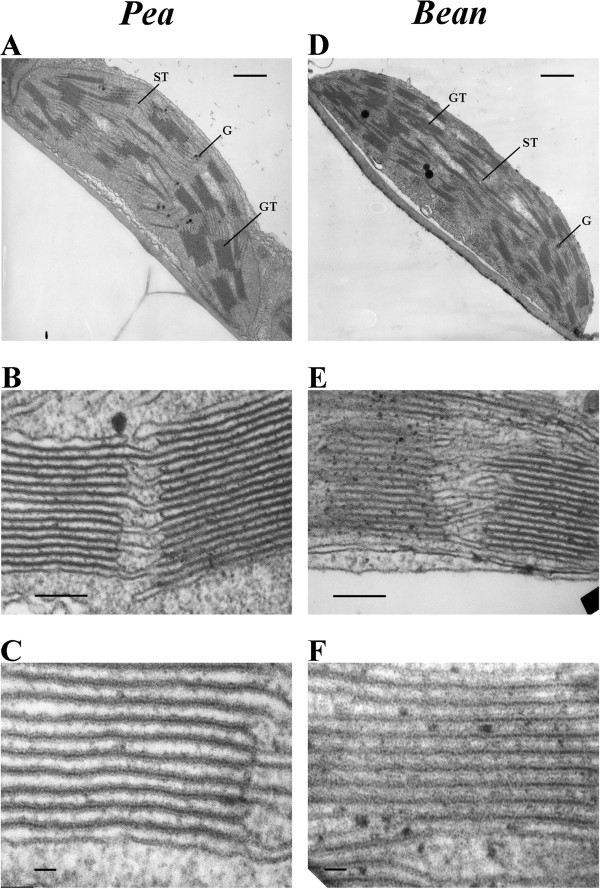
Figure 2.
Mesophyll chloroplast images revealed by TEM. Pictures show different thylakoid arrangements in pea (A) and bean chloroplasts (D), larger appressed thylakoids regions in pea (B) than in bean (E) and wider thylakoid lumen in pea (C) than in bean (F). Bar = 500 nm (A, D); 100 nm (B, E); 20 nm (C, F).

