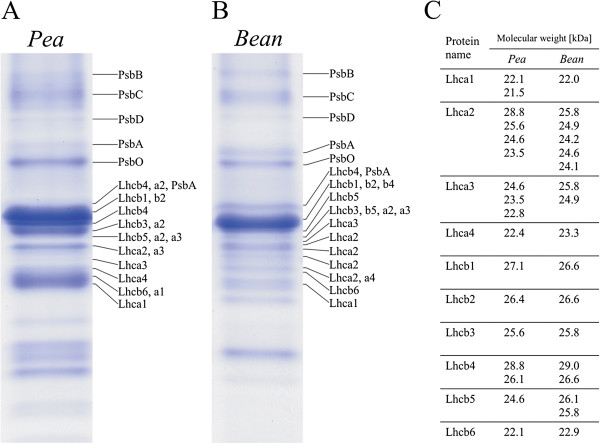
Figure 3.
Protein analysis of pea and bean thylakoid membranes. SDS-PAGE resolution of thylakoid membrane proteins (9 μg of chlorophyll) and visualized by staining with Coomassie Blue R-250 (A, B). Separated bands were analyzed by immunodetection and identified by mass spectrometry. Molecular weights [kD] of pea and bean Lhca1-4 and Lhcb1-6 are given in the table (C).

