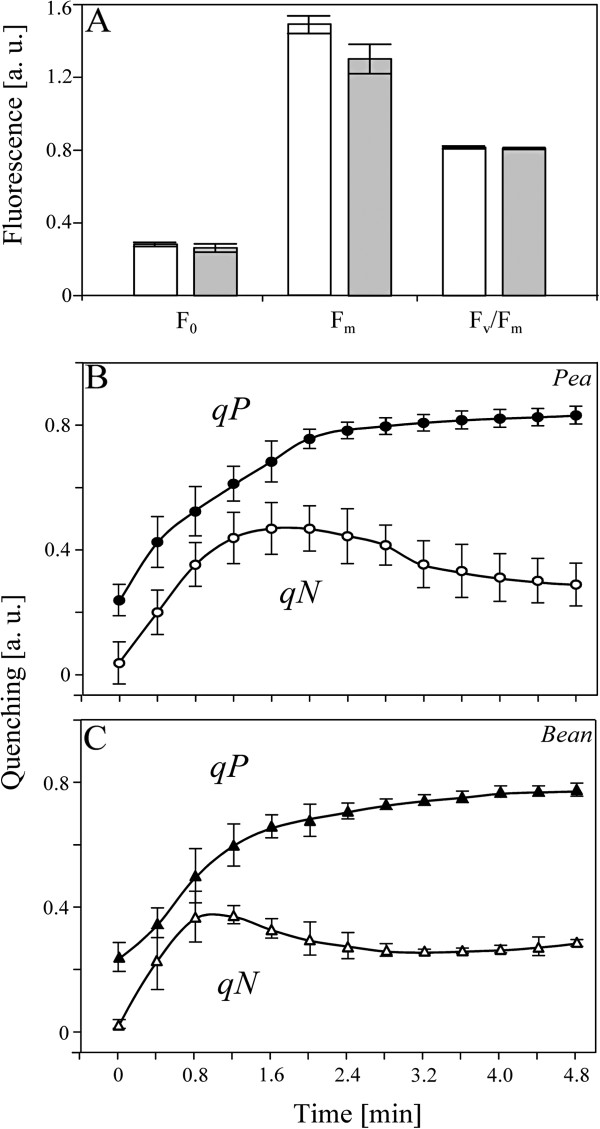
Figure 8.
The PSII functioning of pea and bean measured by PAM fluorescence. Comparison of F0, Fm and Fv/Fm parameters for pea (empty bars) and bean (solid bars) (A). The rise of quenching parameters in pea (qP - closed circles, qN - empty circles) (B) and bean (qP - closed triangles, qN - empty triangles) (C). Measurements were performed on dark-adapted pea and bean leaves. The data are mean values ± SD for 3 independent experiments.

