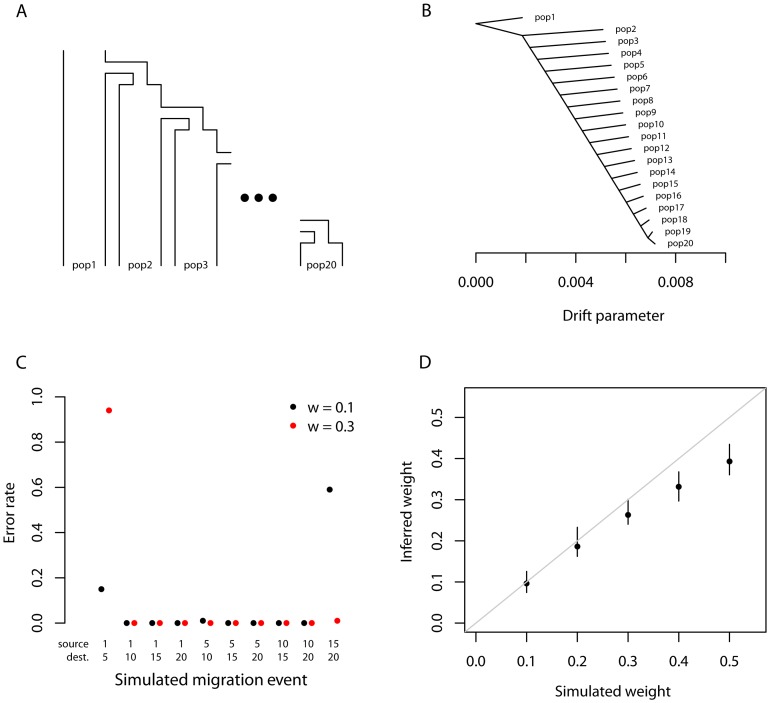
Figure 2. Performance on simulated data.
A. The basic outline of the demographic model used. B. Trees inferred by TreeMix. We simulated 100 independent data sets, under the demographic model in A., and inferred the tree. All simulations gave the same topology; plotted are the mean branch lengths. C. Performance in the presence of migration. We added migration events to the tree in A. and inferred the structure of the graph. Each point represents the error rate over 100 independent simulations, defined as the fraction of simulations where the inferred graph topology does not perfectly match the simulated topology. On the x-axis we show the populations involved in the simulated migration event; e.g., if the source population is 1 and the destination population is 10, this is a migration event from population 1 to population 10, as labeled in A. D. Admixture weight estimation. We simulated admixture events with different weights from population 1 to population 10, and inferred the weight. Each point is the mean across 100 simulations, and the bar represents the range.

