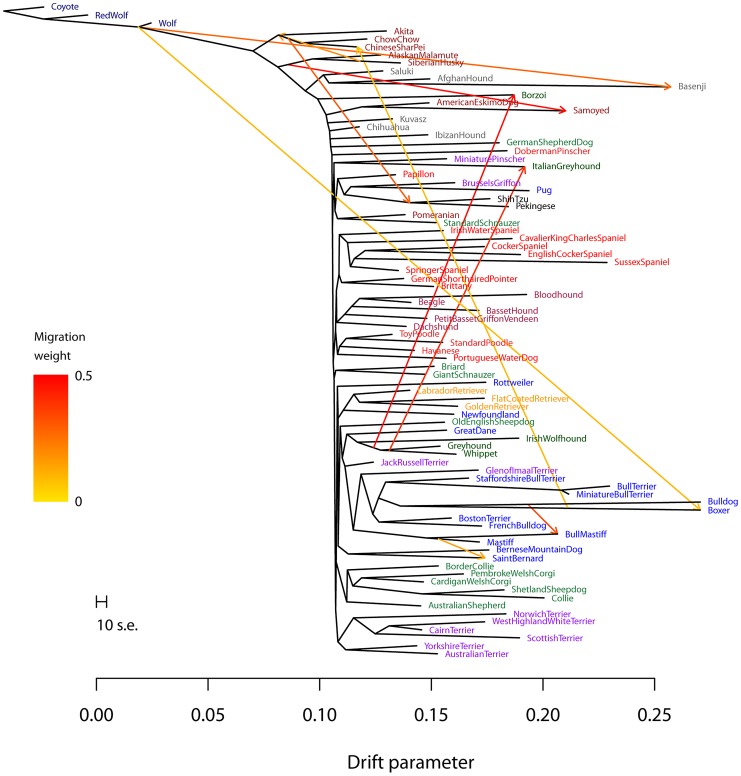
Figure 6. Inferred dog graph.
Plotted is the structure of the graph inferred by TreeMix for dog populations, allowing ten migration events. Migration arrows are colored according to their weight. The scale bar shows ten times the average standard error of the entries in the sample covariance matrix ( ). See the main text for discussion. The residual fit from this graph is presented in Figure S13.

