
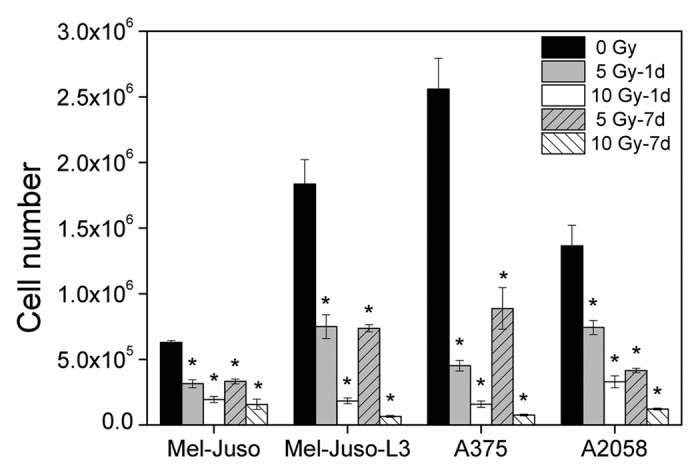
Figure 1. Decrease in proliferation after irradiation. Cells were seeded with 1 × 10⁵ cells per well in 6-well plates and cultured overnight. Cells were irradiated with 5 or 10 Gy or remained untreated, followed by cell counting every 24 h, up to 3 d. For growth assay 7 d after X-ray, cells were irradiated with 5 or 10 Gy and cultured for another 6 d. Then, cells were plated with 1 × 10⁵ cells per well in 6-well plates and counted every 24 h, up to 3 d. Y axis displays cell number per well at the 3rd day of cell counting. Three independent experiments, each in duplicate were performed. Symbols represent means ± SEM, (p ≤ 0.01, two-tailed), *, vs. 0 Gy; Mann-Whitney U test.