
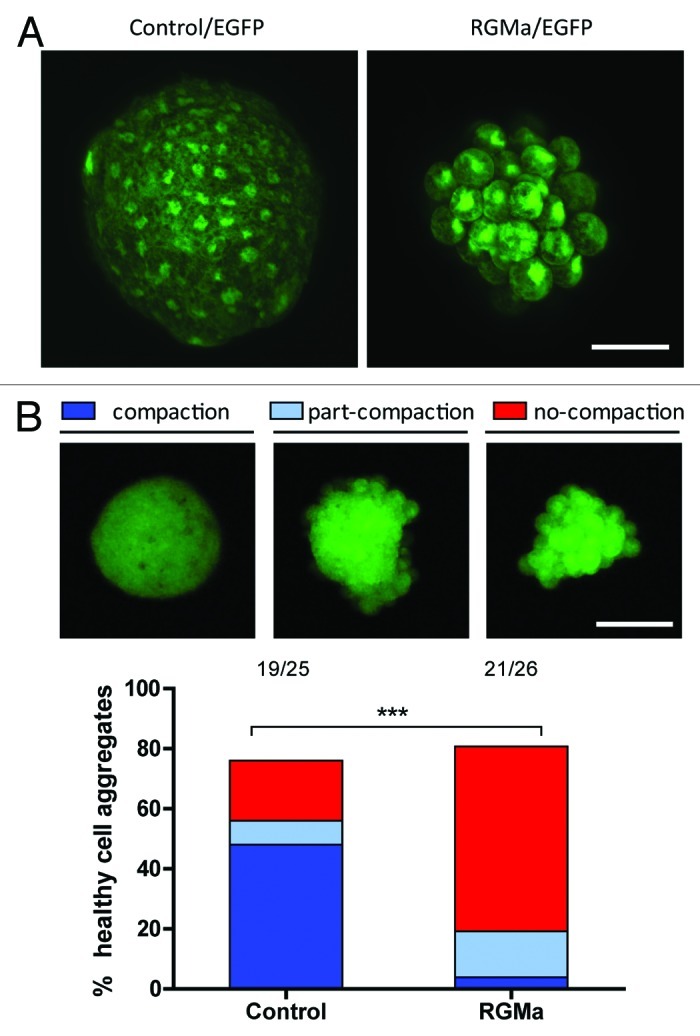
Figure 3. RGMa overexpressing animal cap stem cells showed impaired cell compaction. A single blastomere was isolated from the blastula animal cap stem cell population and cultured on a non-adherent substrate. (A) Confocal z-stacked images of a control eGFP expressing cell aggregate and an RGMa + eGFP expressing cell aggregate derived from a single animal cap cell. Unlike controls, RGMa overexpressing cell aggregates exhibited defects in cell compaction. While RGMa overexpressing cell aggregates generally showed less number of cells within the aggregate in our assay, the size of cell clusters were variable in both control and RGMa overexpressing groups. (Scale bar = 50 μm). (B) RGMa overexpressing cell aggregates showed significantly higher percentage of cell aggregates with compromised cell compaction. The cell aggregates were classified into three different groups: compaction, part-compaction and no-compaction. The representative images for each group are shown below the labels. The bar graph indicates the percentage of healthy cell aggregates within each category from control and RGMa overexpressing groups. The cell aggregates from both control and RGMa overexpressing cells showed comparable survival rate (~80%) whereas RGMa overexpressing cell aggregates showed significantly higher percentage of cell aggregates with compromised cell compaction (Chi-square test of homogeneity, ***p < 0.001). Numbers on the top of the graph indicate raw numbers of cell aggregates analyzed in the study. (Scale bar = 100 μm).