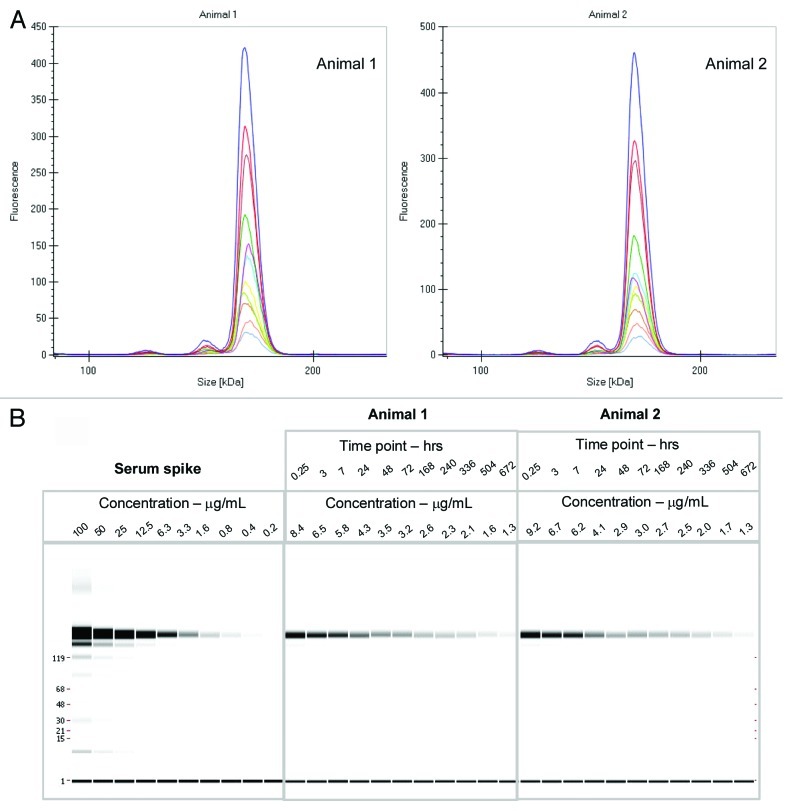
Figure 2. (A) Electropherogram of rat serum samples (two animals) dosed with labeled mAb and analyzed at various time points (0.25 h to day 28) (B) Digital gel image after serial dilution of labeled mAb spiked into rat serum in vitro, and analysis of rat serum samples from PK study with labeled antibody after a 1:10 dilution in denaturation buffer.

An official website of the United States government
Here's how you know
Official websites use .gov
A
.gov website belongs to an official
government organization in the United States.
Secure .gov websites use HTTPS
A lock (
) or https:// means you've safely
connected to the .gov website. Share sensitive
information only on official, secure websites.
