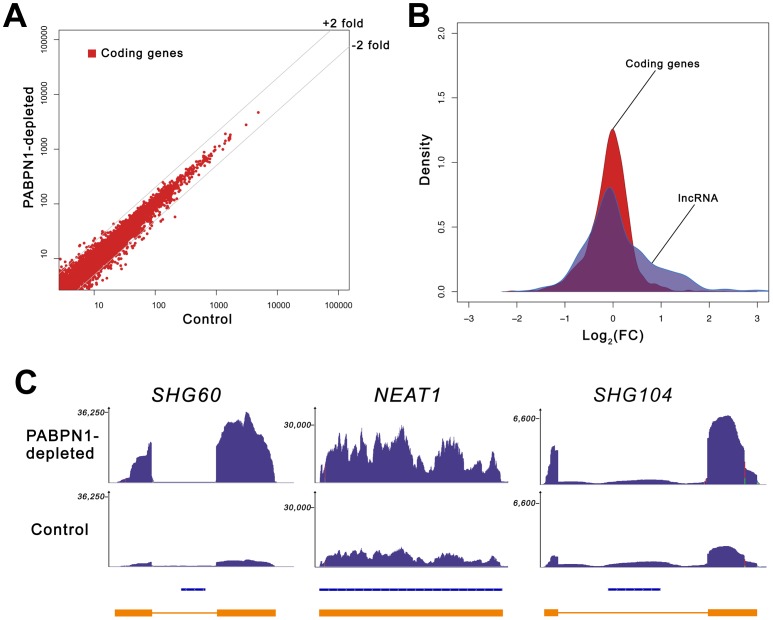
Figure 2. Loss of PABPN1 induces specific changes in gene expression.
(A) Comparison of gene expression changes in PABPN1–depleted (y-axis) and control (x-axis) cells, measured in reads per kilobase per million reads (RPKM). Coding genes (red dots) are defined as all UCSC genes with an associated protein ID. (B) Shown is the distribution of log ratios/fold-change (FC) in expression levels for protein-coding (red) and lncRNA (blue) genes using Kernel density estimation. The original histograms are shown in Figure S1. The set of lncRNA genes comprises all genes from the lincRNA catalog [26], lncRNA database [82], and genes from the noncode database [83] longer than 200-nt. (C) RNA-seq read distribution along three lncRNA genes for PABPN1–depleted (top row) and control (middle row) cells. Bottom row shows gene annotations for the corresponding regions: Refseq genes (blue) and inferred gene structure from RNA-seq data (orange). SHG60 and SHG104 (SNORD60 and SNORD104 Host Genes, respectively); NEAT1 (nuclear enriched abundant transcript 1).

