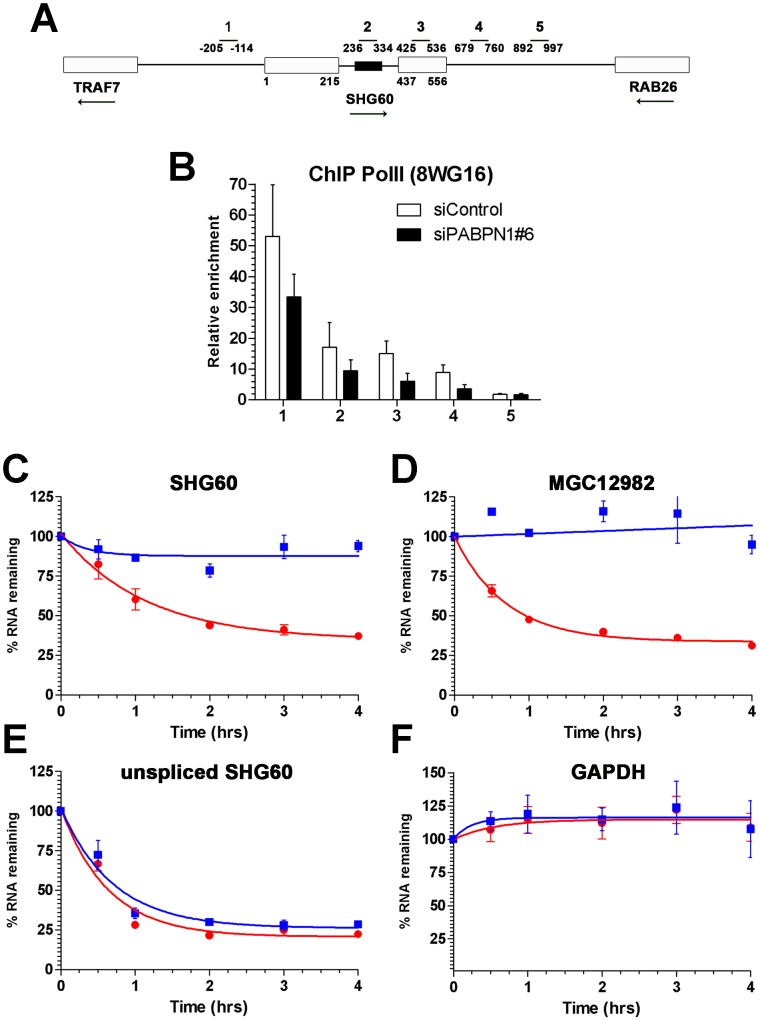
Figure 4. PABPN1 promotes lncRNA turnover.
(A) Schematic diagram of the SHG60 gene. White boxes represent exons and the small black box corresponds to the SNORD60 snoRNA located in the SHG60 intron. The TRAF7 and RAB26 protein-coding genes located upstream and downstream, respectively, of SHG60 are also shown. Nucleotides numbers are relative to the first nucleotide from exon 1 of SHG60. Bars above the gene show the position of PCR products used for analyses in ChIP assays and for identification in panel B. (B) ChIP assays were performed on extracts prepared from cells treated with control (white bars) and PABPN1–specific (black bars) siRNAs using a monoclonal antibody (8WG16) specific to RNA Pol II. The coprecipitating DNA was quantified by real-time PCR using gene-specific primer pairs located along the SHG60 gene (see panel A). ChIP data are presented as the fold enrichment of RNA Pol II relative to control purifications performed without antibody. Values represent the means of at least three independent experiments and bars correspond to standard deviations. (C–F) HeLa cells previously transfected with control (red circles) and PABPN1–specific (blue squares) siRNAs were treated with 5 µg/ml actinomycin D, and RNA was isolated at time zero and intervals thereafter indicated. RNA decay rates of the spliced SHG60 lncRNA (C), MGC12982 lncRNA (D), unspliced SHG60 transcripts (E), and GAPDH mRNA (F) were determined by quantitative RT-PCR analysis and normalized to the PABPC1 mRNA. The data and error bars represent the average and standard deviation from three independent experiments.

