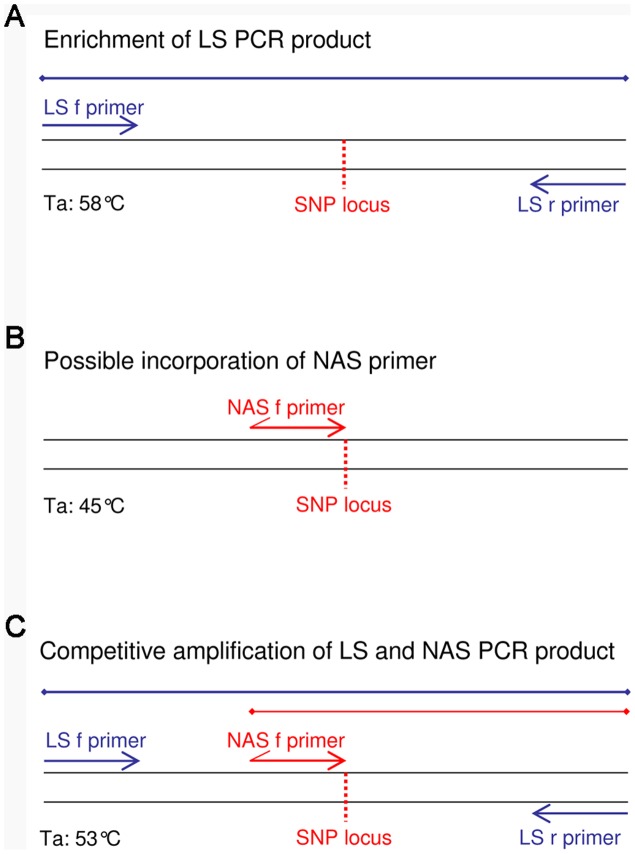
Figure 2. Schematic illustration of TSP assay performance.
NAS and LS primer locations relative to the M. ulcerans DNA sequence surrounding a SNP locus are shown for the different PCR reaction phases. A Initial PCR conditions enable an amplification of the larger LS PCR product by applying an annealing temperature (Ta) of 58°C. B Reduction of Ta to 45°C facilitates a possible incorporation of the NAS primer into the enriched LS PCR product. C Competitive amplification of the larger LS and the smaller NAS PCR products are ensured by an increase of Ta to 53°C.

