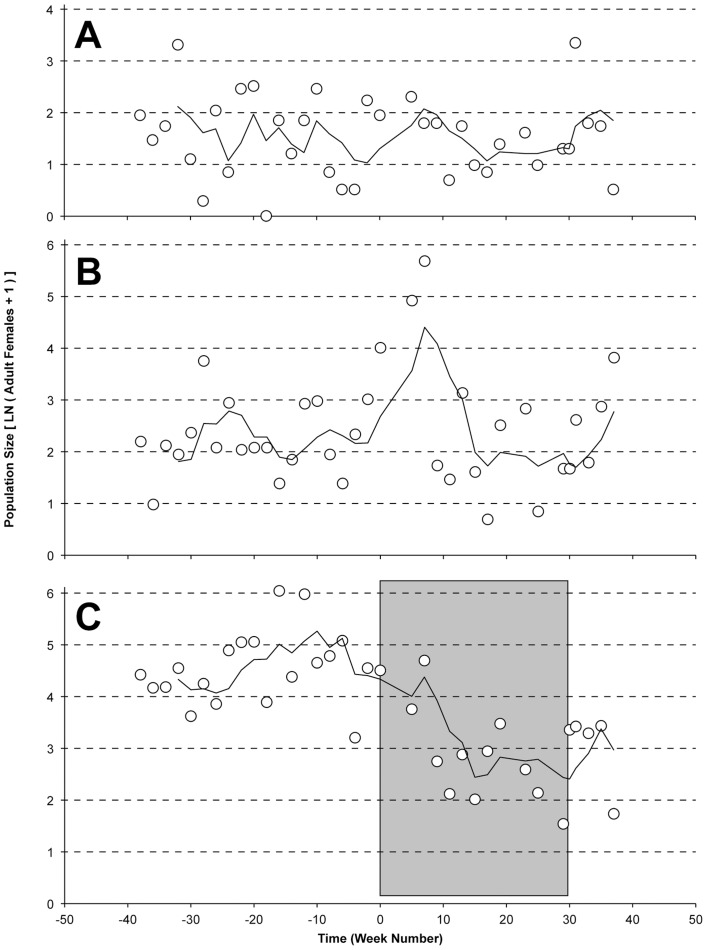
Figure 1. A. polynesiensis population dynamics.
Collection data is shown for the A) Tiano (ANO), B) Horea (HOR) and C) Toamaro (TOA) study sites, as measured by BG trap collections of adult females. Lines show moving averages across four collection periods. Time is shown as the relative week number, with ‘Week 0’ as the start of releases. The grey shaded box indicates the release period on TOA, with CP releases ending on Week 30.

