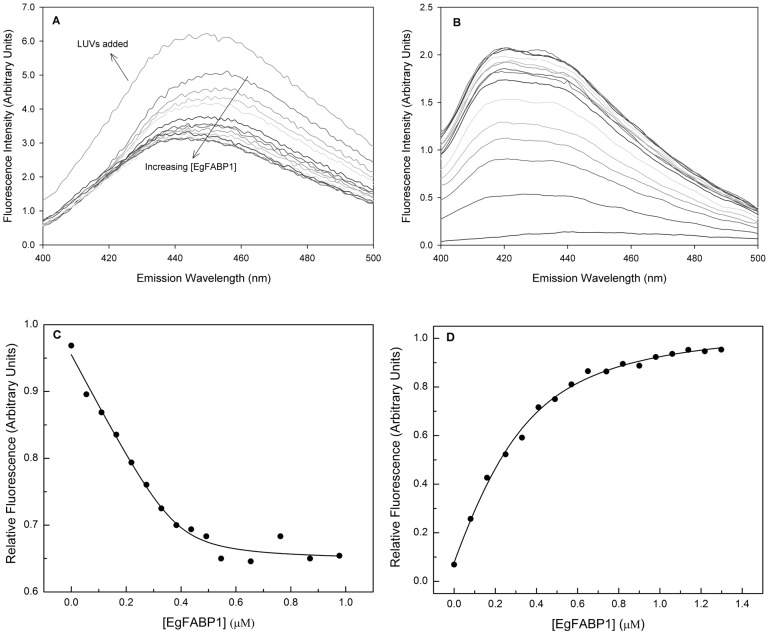
Figure 3. Fluorimetric titration of fluorescent fatty acid analogues with EgFABP1.
(A) Emission spectra of 16AP bound to EgFABP1 is shown. Changes in relative 16AP fluorescence were monitored from 400 to 500 nm after excitation at 383 nm upon incremental 0,05 µM additions of EgFABP1 to a cuvette initially containing 2 mL of 0,5 µM 16AP in TBS buffer. 16AP emission spectra show a remarkable blue shift that accompanies fluorescence decrease upon binding to EgFABP1. Fluorescence is recovered after the addition of 10 µM EPC large unilamellar vesicles (LUVs). (B) Emission spectra of 12AS bound to EgFABP1 are shown. Changes in relative 12AS fluorescence were monitored from 400 to 500 nm after excitation at 383 nm upon incremental 0.05 µM additions of EgFABP1 to a cuvette initially containing 2 mL of 0.5 µM 12AS in TBS buffer. 12AS spectra show a remarkable blue shift that accompanies fluorescence increase. (C) Changes in relative 16AP fluorescence were recorded at 440 nm in order to build the binding isotherm. The data are consistent with one binding site per monomer unit of protein and a Kd value of 0.013±0.006 µM. The solid line is the theoretical binding curve for complex formation. One representative experiment of three is shown. (D) Changes in relative 12AS fluorescence were recorded at 440 nm to build the binding isotherm of the complex EgFABP1-12AS. The data are consistent with one binding site per monomer unit of protein and a Kd value of 0.12±0.02 µM. The solid line is the theoretical binding curve for complex formation. One representative experiment of four is shown.

