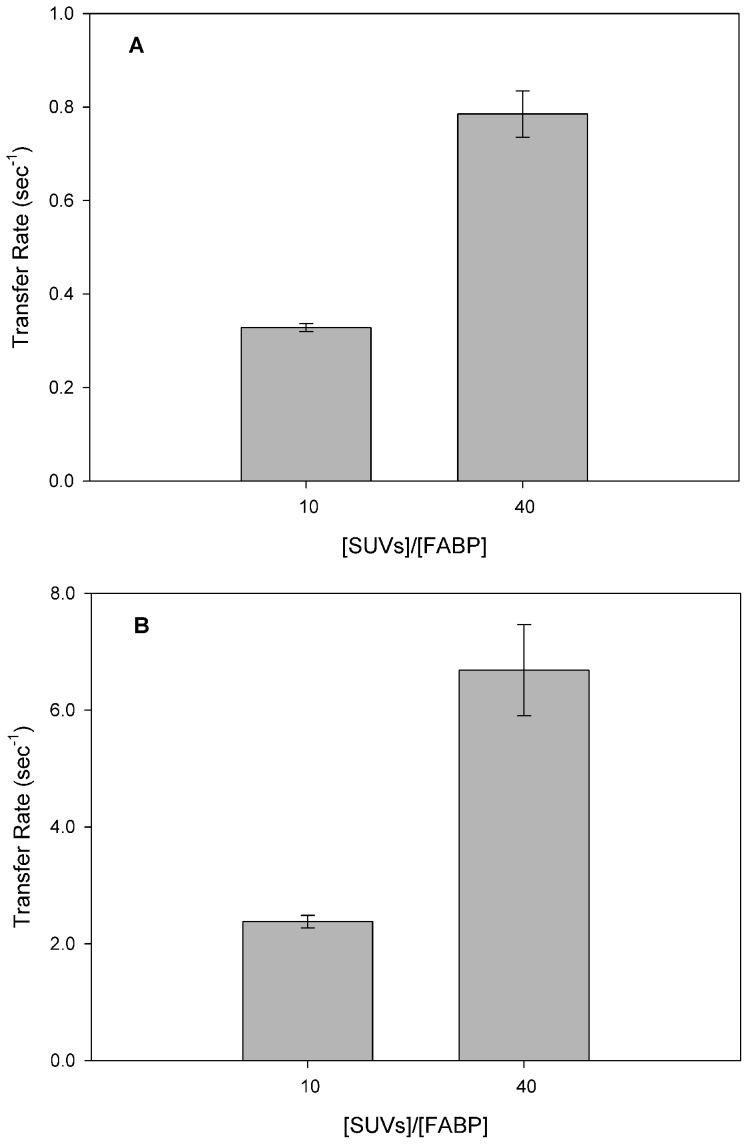
Figure 6. Effect of acceptor membrane concentration on 12AS transfer rates from EgFABP1 to charged SUVs.
Transfer rate from EgFABP1∶12AS (15∶1 mol∶mol) complex to 1∶10 mol∶mol or 1∶40 mol∶mol EgFABP1∶EPC/NBD-PC SUVs containing either (A) 25 mol % PS or (B) CL were measured. Averages from two different experiments ± SD are shown.

