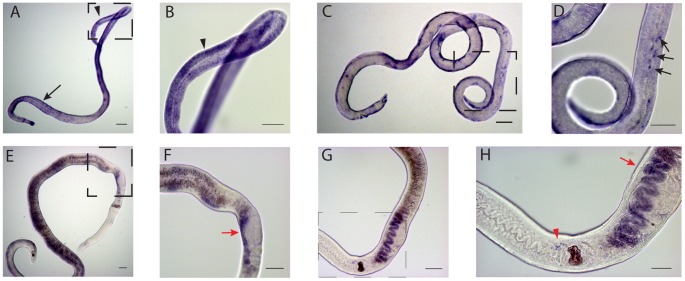
Figure 7. WISH analysis of AFSS transcripts in female worms.
Panel A: 6767 localized in AFSS worms. Panel B: higher magnification view of the boxed area in image A. 6767 localizes to vitellocytes (arrowhead) and subtegumental cytons (arrow). Panel C: 15402 localized in AFSS worms. Panel D: higher magnification view of the boxed area in image C. 15402 localizes in a punctate staining pattern in subtegumental cytons (arrows in D). Panel E: 6767 localized in AFMS worms following in vitro culture for 3 days. Panel F: higher magnification view of the boxed area in image E. 6767 transcripts are detected in the ovo-vitelline duct (red arrows). Panel G: 15402 localized in AFMS worms following in vitro culture for 3 days. Panel H: higher magnification view of the boxed area in image G. 15402 transcripts are detected in the ovo-vitelline duct (red arrows) and in a punctate staining pattern surrounding the ootype (red arrowhead). Scale bars are 100 µm in A,C, E, F and G and 50 µM in B, D, and H. All images generated with a Zeiss AxioStar Plus microscope.

