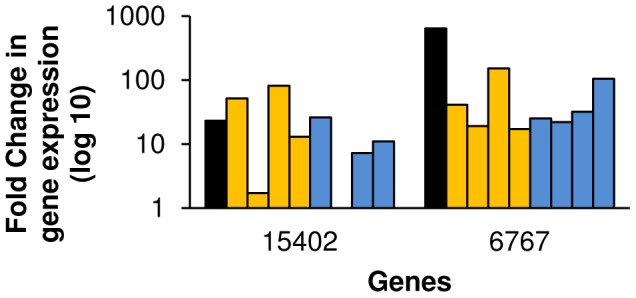
Figure 8. Transcription of sexually immature worm-enriched genes in sexually mature female worms.

Relative abundance was measured during regression using the 2−ΔΔCt method. S. mansoni β-tubulin was used as an endogenous control and female worms from a mixed sex infection without in vitro culture were used for normalization. Black bars represent the relative abundance in unpaired, sexually immature females compared to paired, sexually mature females (AFSS:AFMS). Gold bars represent abundance in females paired with a male after 1, 2, 3, and 7 days (from left to right) in culture. Blue bars represent females cultured without a male after (from left to right) 1, 2, 3, and 7 days, respectively.
