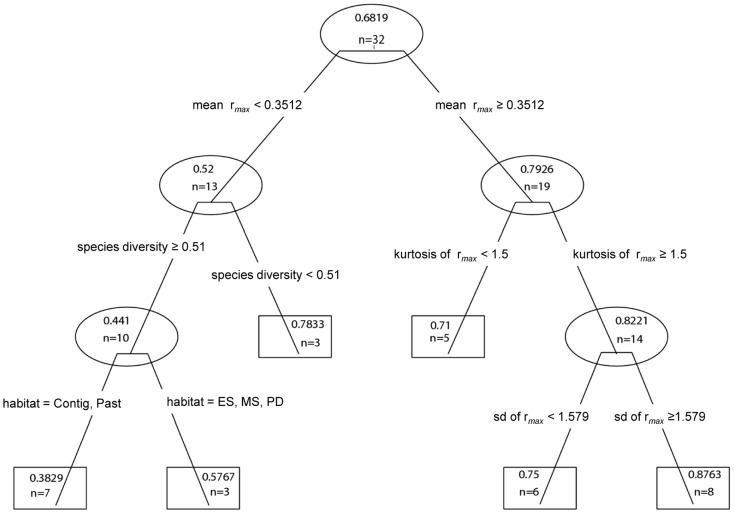
Figure 2. Regression tree analysis of Trypanosoma cruzi vector infection per site.
Non-terminal nodes are surrounded by ovals and terminal nodes are surrounded by rectangles. Explanatory variables are Habitat type (type = Contig; Contiguous forest, Past; Cattle Pasture, ES; Early secondary forest fragment, MS; Mid-secondary forest remnant ,PD; peridomiciliary). Species diversity is the Shannon-Weiner index. Mean is mean rmax, the maximum intrinsic rate of population increase, and kurtosis and standard deviation (sd) of the rmax values per site are also shown. Each of four splits (nonterminal nodes) is labeled with the variable and values that determined the split. The number of sites that corresponded to each node is shown at the node. The predicted vector infection prevalence for a site is shown at each of the six terminal nodes.

