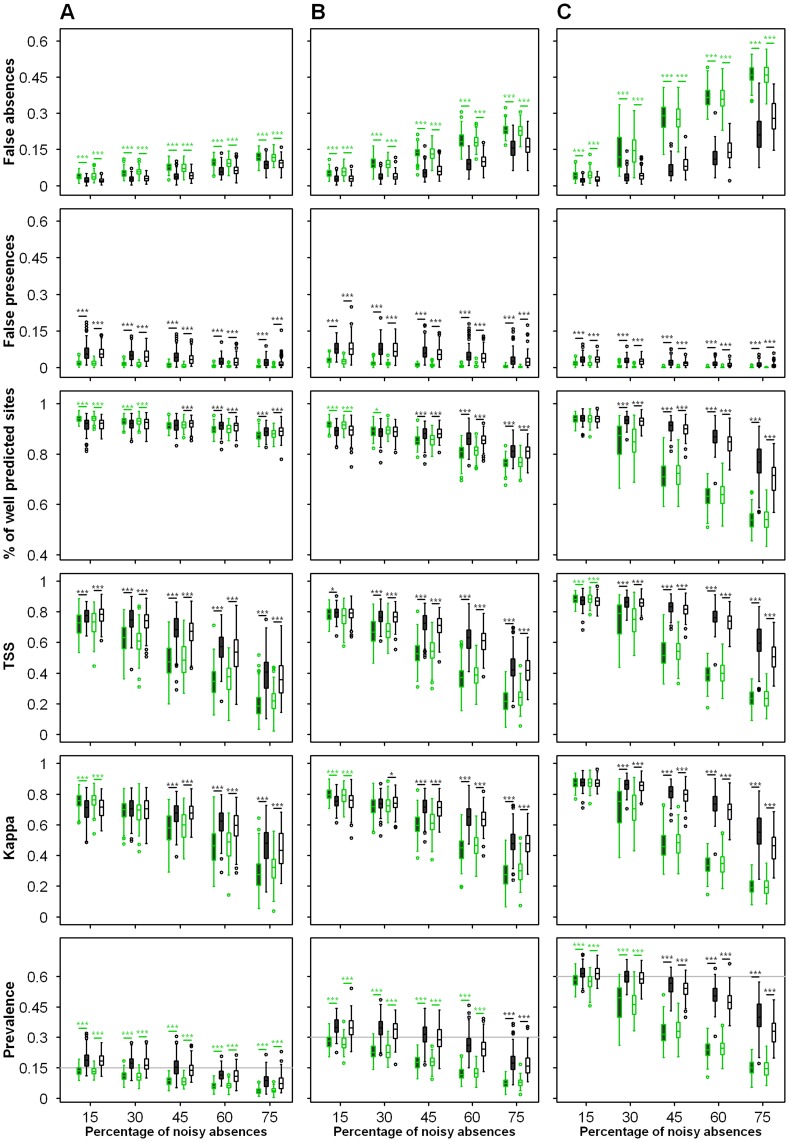
Figure 4. Figure.
4. Effects of noisy absences on threshold-dependent measures of model accuracy after the first iteration (EM, in green) and at the end of the process (IEM, in black) for three virtual species with true prevalence of (A) 15%, (B) 30% and (C) 60%. Model accuracy was evaluated using the two types of mispredicted sites, percentage of well-predicted sites, TSS, Kappa, and predicted prevalence. Box colors represent geographic distribution of noisy absences (grey: random; white: mostly at the edge of the niche). The grey line corresponds to the true value of the prevalence.

