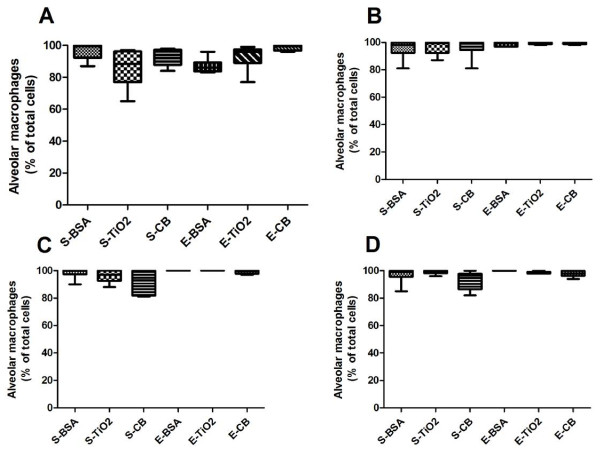
Figure 2 .
Proportion of alveolar macrophages in BAL. Quantification of the differential cell count in BAL at D8 (A, C) and D21 (B, D) post elastase treatment, in presence of 100 μg (A, B) or 500 μg (C, D) NPs. n = 6. Abbreviations are the same as in Figure1. Box plots show median and interquartile range (25th and 75th percentiles).

