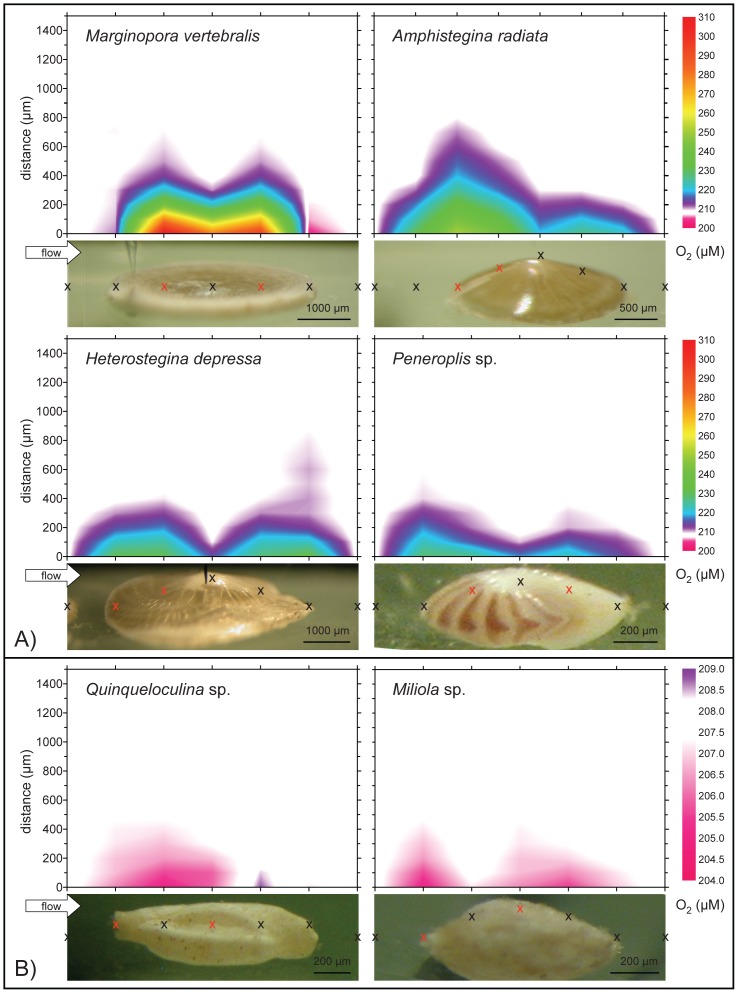
Figure 1. Microenvironmental O2 heterogeneity at a pCO2 of 432 µatm, 30 µmol photons m−2 s−1 light, and 0.5 cm s−1 water flow across foraminiferal shell surfaces.
Data derived from fine-scale microsensor profiles at the points indicated by the crosses. Red crosses indicate the measurement positions (n = 2–4) used for the calculation of means per individual. Note the different contour scales between A) photosymbiotic and B) symbiont-free species.

