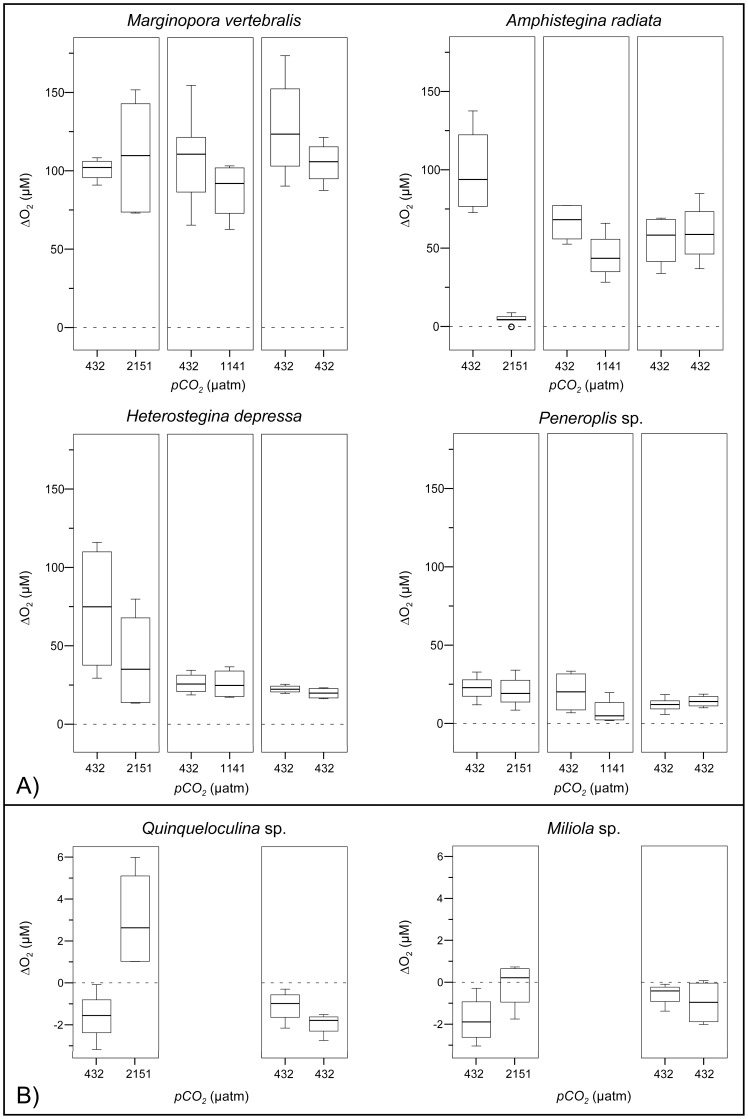
Figure 3. Box-plots representing the 25th, 50th and 75th percentiles of ΔO2, calculated from profiles measured within individuals (n = 2) prior (at 432 µatm) and during pCO2 treatment incubations (432, 1141, 2151 µatm), under illumination (30 µmol photons m−2 s−1) for the six foraminiferal species.
Note the different scales between A) photosymbiotic and B) symbiont-free species. Outliers (>1.5 interquartile range) are indicated by circles.

