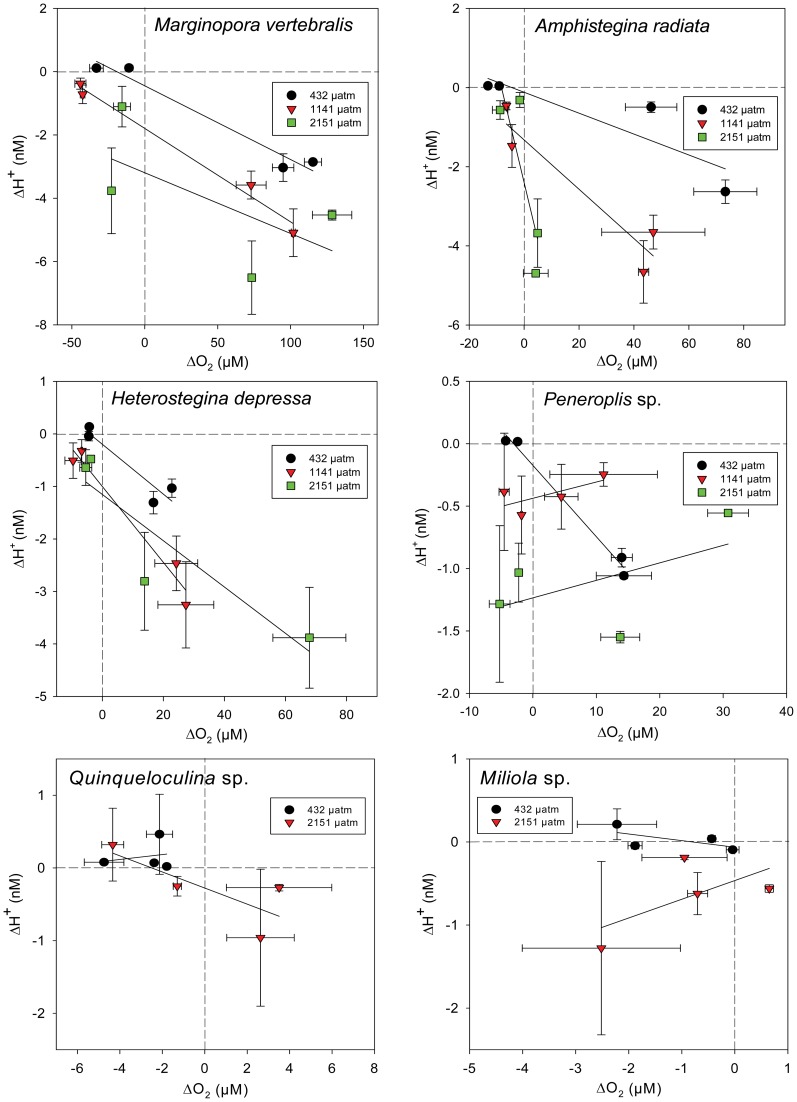
Figure 7. Relationship between mean ΔH+ and ΔO2 at different pCO2 treatment groups for light (30 µmol photons m−2 s−1) and dark conditions.
Each point represents an individual foraminiferal test (mean ± SE, n = 2–4). Solid lines indicate linear correlations for the different pCO2 treatment groups, dashed lines indicate the respective ΔO2 and ΔH+ zero-lines.

