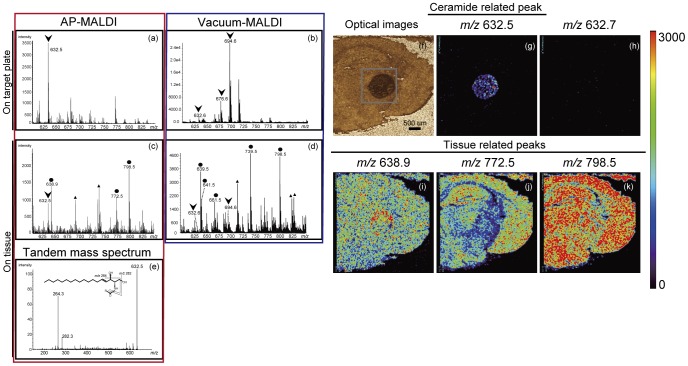
Figure 2. Detection of Ceramides by mass spectrometry.
The ionization patterns of Cer standard (d18∶1/C24∶0) deposited on stainless-steel target plates with AP ion-source instrument (a) and vacuum-type instrument (b). The Cer standard (d18∶1/C24∶0) was deposited onto a mouse brain tissue section and the mass spectrum was acquired (c and d). A subsequent tandem mass spectrometric analysis of precursor ions at m/z 632.5 was shown (e). The optical image (f) and ion image revealed that m/z 632.5 was predominantly derived from exogenous Cer (g). The ion image at m/z 632.7 is also shown (h). Moreover, we visualized ion images of major tissue-derived signals (m/z 638.9, 772.5, and 798.5) (i–k). Color bar shows signal intensity.

