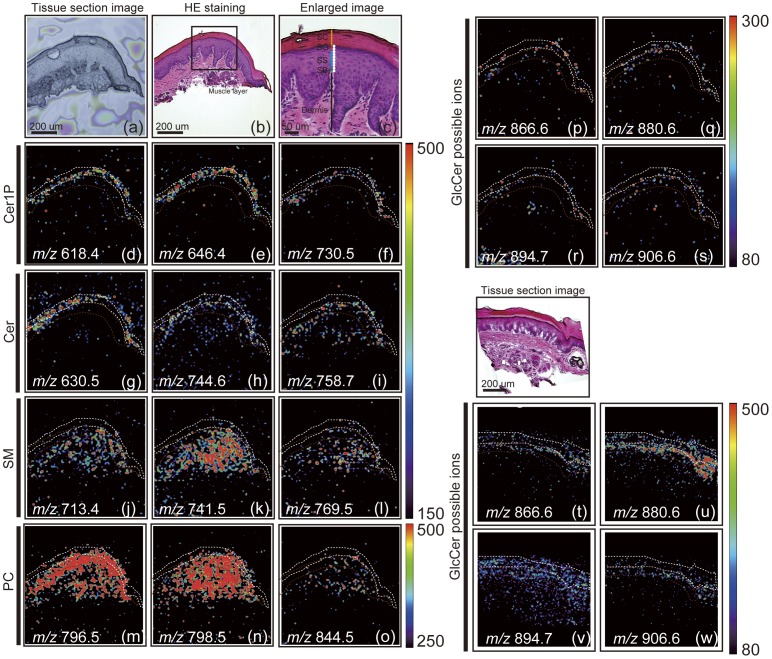
Figure 3. IMS analyses revealed the localization of Cer and Cer-related ions in a mouse footpad skin section.
Optical image of mouse footpad section (a), the HE staining image of the serial section (b), the enlarged image (c) are shown. We could detect four layers in the epidermis: SC, SG, SS, and SB. Ion images of Cer1P (d–f), Cer (g–i), SM (j–l), PC (m–o) and GlcCer possible ions (p–s) are shown (SC indicated as a white line; SS and SG indicated as brown lines). We tried to increase sensitivities of GlcCer by limiting detection mass ranges, 800–1200 (t–w). The imaging pixel is 10 µm (a white dot indicates 10 µm, [c]). Color bar shows signal intensity.

