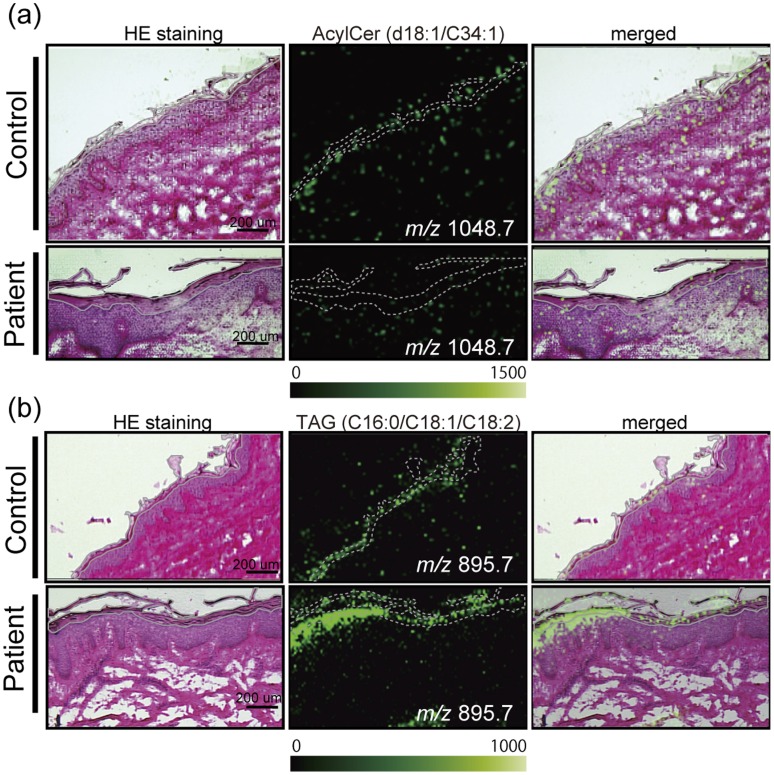
Figure 4. IMS analyses of clinical samples.
IMS analysis demonstrates deficiencies of AcylCer (a) (S/N ratio: 9) and, conversely, the accumulation of TAG (b) in the SC (indicated as a gray line) of a DCS patient compared with a normal human subject. The scale bar shows 200 µm. The imaging pixel is 10 µm. Color bar shows signal intensity.

