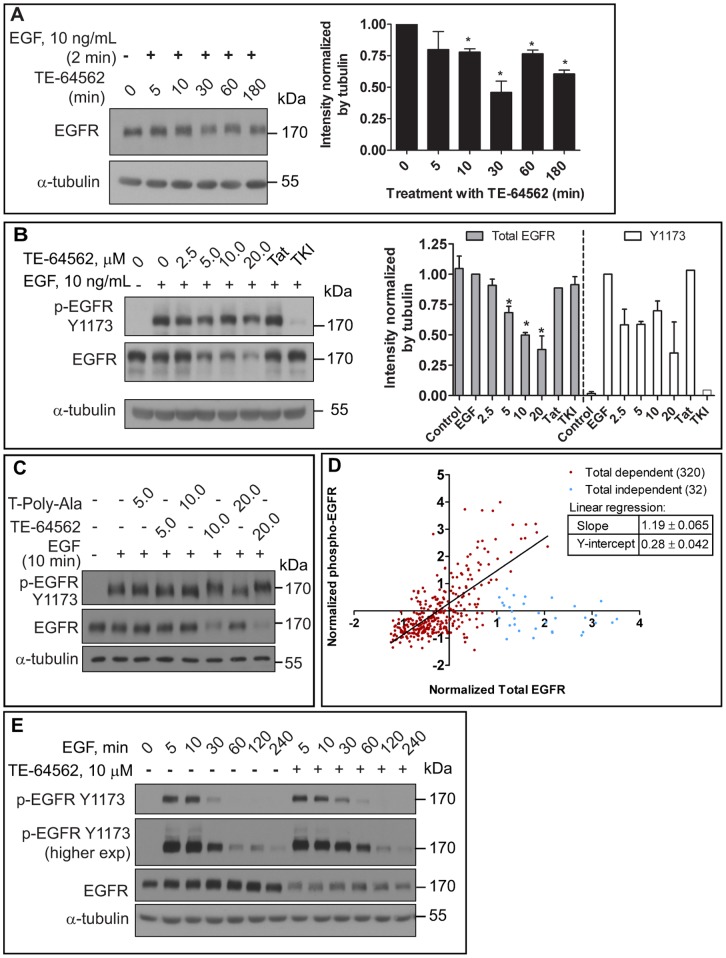
Figure 6. TE-64562 causes EGFR down-regulation and prolongs EGFR phosphorylation.
(A) Serum starved MDA-MB-231 cells were treated with EGF for 2 minutes followed by TE-64562 (10 µM) treatment for the indicated amounts of time. The intensity of the EGFR bands was quantified with respect to the intensity of the respective α-tubulin bands. Mean intensity values are plotted from two independent experiments and error bars represent the standard error of the mean. Significance was assessed by a two-tailed, unpaired t test (*P<0.026). (B) Serum starved MDA-MB-231 cells were treated with TE-64562 (2.5, 5.0, 10.0 and 20.0 µM), Tat (20 µM), an EGFR specific tyrosine kinase inhibitor (TKI, 2.0 µM) or vehicle for 30 minutes, followed by EGF treatment (10 ng/mL) for 10 minutes. Results are representative of three independent experiments. The intensity of the EGFR (N = 3 to 7, depending on concentration) or phospho-EGFR (N = 2) bands were quantified with respect to the intensity of the respective α-tubulin band. Mean intensity values are plotted from two (phospho) or three or more (total) independent experiments and error bars represent the standard error of the mean. Significant differences (Mann-Whitney test) were assessed between each treatment condition and untreated control (*P<0.03). (C) Serum starved MDA-MB-231 cells were treated with TE-64562 (5.0, 10.0 and 20.0 µM) or T-Poly-Ala control peptide (5.0, 10.0 and 20.0 µM) or vehicle for 30 minutes, followed by EGF treatment (10 ng/mL) for 10 minutes. Results represent one of three independent experiments. (D) Correlation plot of breast cancer data from The Cancer Genome Atlas. The normalized EGFR protein expression data from antibody array data was plotted for each individual in the study. Shown in red are the 320 individuals who showed a positive correlation between EGFR expression and phospho-EGFR Y1173 levels. Shown in blue are the 32 individuals who did not show a correlation. Plotting and linear regression were performed in Prism 5.0 (GraphPad Software, Inc., USA). (E) Serum starved MDA-MB-231 cells were treated with TE-64562 (10 µM) or vehicle for 30 minutes followed by EGF (10 ng/mL) for 5, 10, 30, 60 120 or 240 minutes. Cell lysates were collected and analyzed by Western blot for phospho-EGFR (Y1173) and EGFR. Blots were stripped and re-probed for α-tubulin. Also see Figure S5.

