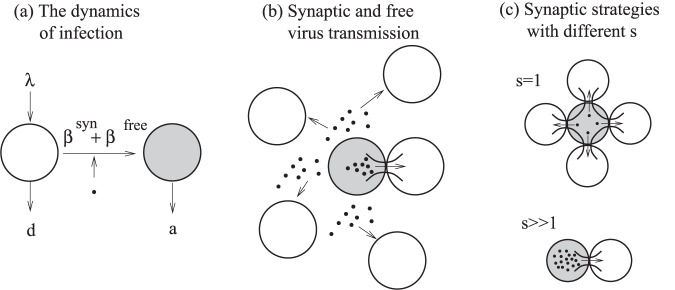
Figure 1. A schematic explaining the structure of the model.
Here, uninfected cells are represented by white circles, infected cell by shaded circles, and viruses by black dots. (a) The overall virus dynamics, including production and death of target cells, the death of infected cells, and infection. (b) The process of infection contains two modes of transmission, free-virus and synaptic transmission. (c) Kinetics of synaptic transmission. Synaptic transmission can be performed by means of different strategies that vary by s, the number of viruses transferred per synapse. If s is small, may synapses must be formed (sequentially in time). If s is large, the viral load is transmitted by means of few synapses.

