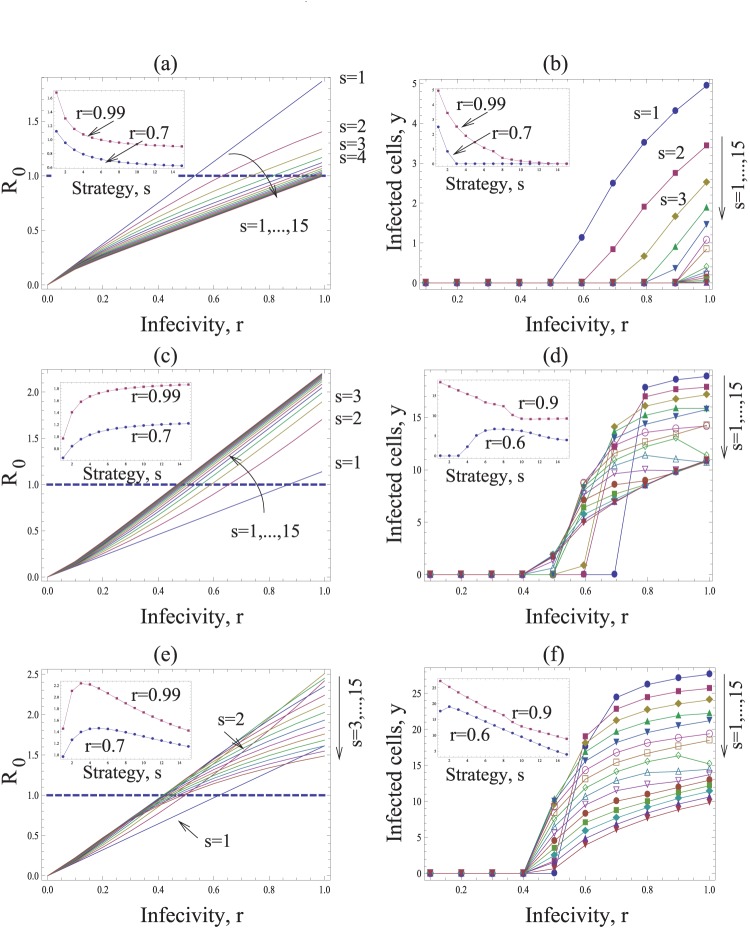
Figure 4. The dependence on the multiplicity of infection.
Same as in figure 3, except the rate of virus production is given by  (a,b) Subadditive dependence without saturation (adding saturation does not change the picture qualitatively), g = 1/2, λ = 8, d = 0.5,
  . (c,d) Superadditive dependence without saturation, g = 2, λ = 20, d = 0.6,
  . (d,e) Superadditive dependence with saturation, g = 2, η = 10, λ = 30, d = 0.6. The insets in (a,c,e) plot the basic reproductive ratio as a function of strategy, s, for two fixed values of r = 0.9. The insets in (b,d,f) plot the number of infected cells as a function of strategy, s, for a two fixed values of r. Other parameters are a = 1, N = 15,
  .
.

