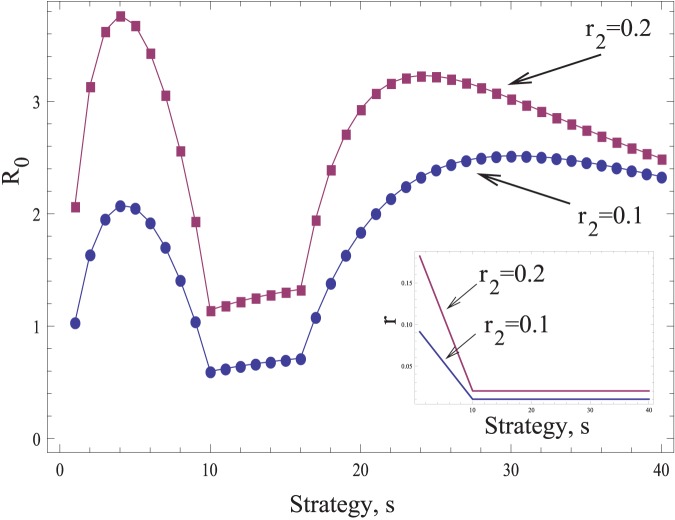
Figure 6. Virus-mediated induction of intracellular defense factors can lead to peaks in R0 for two different viral strategies, s: a “stealth strategy” and a “saturation strategy”.
Plotted is the basic reproductive ratio, R0, as a function of strategy, s, for two different values of the infectivity parameter, r2. The rest of the parameters are as follows:  , d = 0.1, a = 4, n1 = 16. The infectivity parameter r depends on the strategy. It is given by r = r2-s(r2-r2/10)/10 if s<10, and r = r2/10 if
  . These functions are shown in the inset for the two values of r2.

