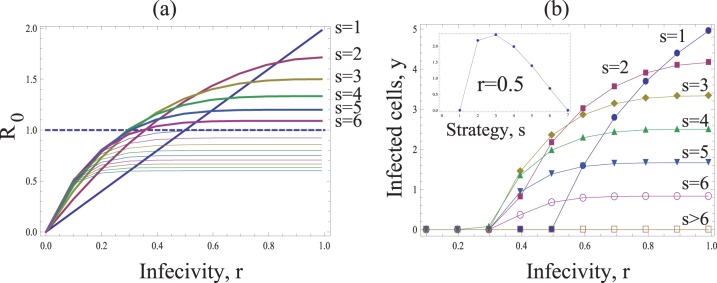
Figure 7. Limited ability of synapse formation.
Same as in figure 3, except for the relationship  . The inset in (b) plots the number of infected cells as a function of strategy, s, for a fixed value r = 0.5. Other parameters are: N = 15, λ = 300, d = 5, a = 30, z = 5, k = 6.

