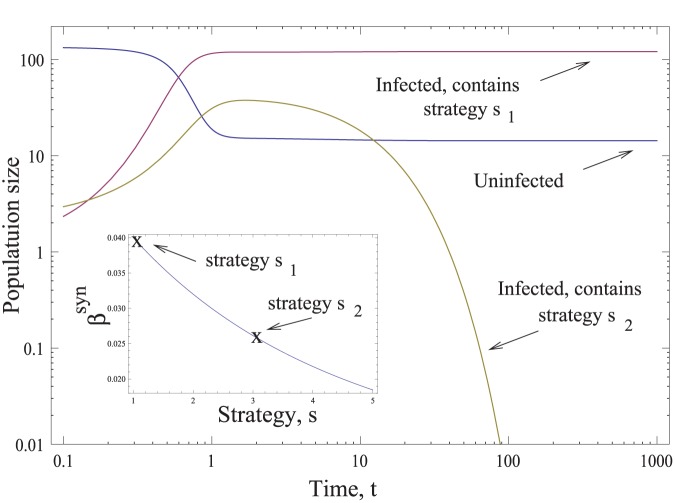
Figure 8. The evolutionary simulations.
The time-dependent solution of the evolutionary virus dynamics simulation is presented (please note the log axes). The uninfected cell population is x00, and the infected populations are presented by two lines, one showing the sum of all cells containing the s1 virus,  , and the other containing the s2 virus,
 . The inset shows the infectivity of the two strains. We used the base-line model for this simulation. The parameters are s1 = 1, s2 = 3, z = 0, Q = 0.1,
 , a = d = 1, N = 5.

