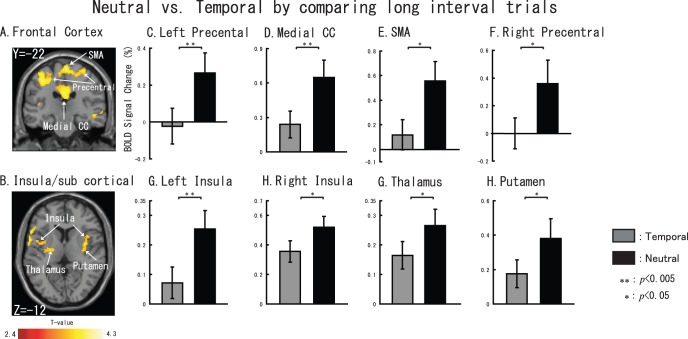
Figure 9. Neutral task vs. Temporal task by comparing long interval trials.
Sliced section results are shown at a threshold of uncorrected p<0.01. (A) left Prefrontal cortex, medial CC, SMA and right Prefrontal cortex. (B) bilateral insula, thalamus and putamen. For C–H, gray represents temporal task vs. control task and black represents neutral task vs. control task. The error bar represents the standard error (SE). Non-parametric comparisons results are shown in the bar graphs (*: p<0.05, **: p<0.005).

