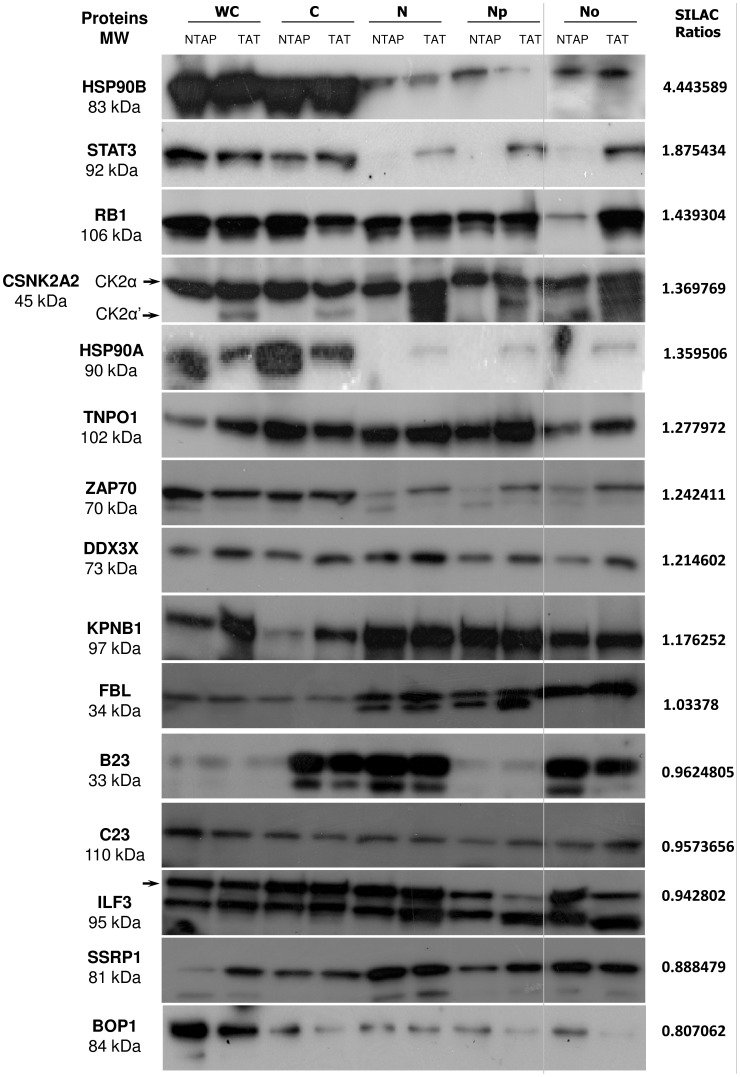
Figure 2. Western-Blot validation of the SILAC quantitative analysis.
Western-Blot results comparing expression levels of selected 15 proteins to their SILAC ratios (right panel). 10 µg total protein of each subcellular fraction (WC: whole cells, C: Cytoplasmic, N: Nuclear, Np: Nucleoplasmic and No: Nucleolar) from Jurkat NTAP (NTAP) and Jurkat NTAP-Tat (TAT) were resolved by SDS-PAGE, blotted and probed with indicated antibodies. For HSP90B, as the nucleolar detection level was low, we increased separately the amount of total protein loaded to 20 µg.

