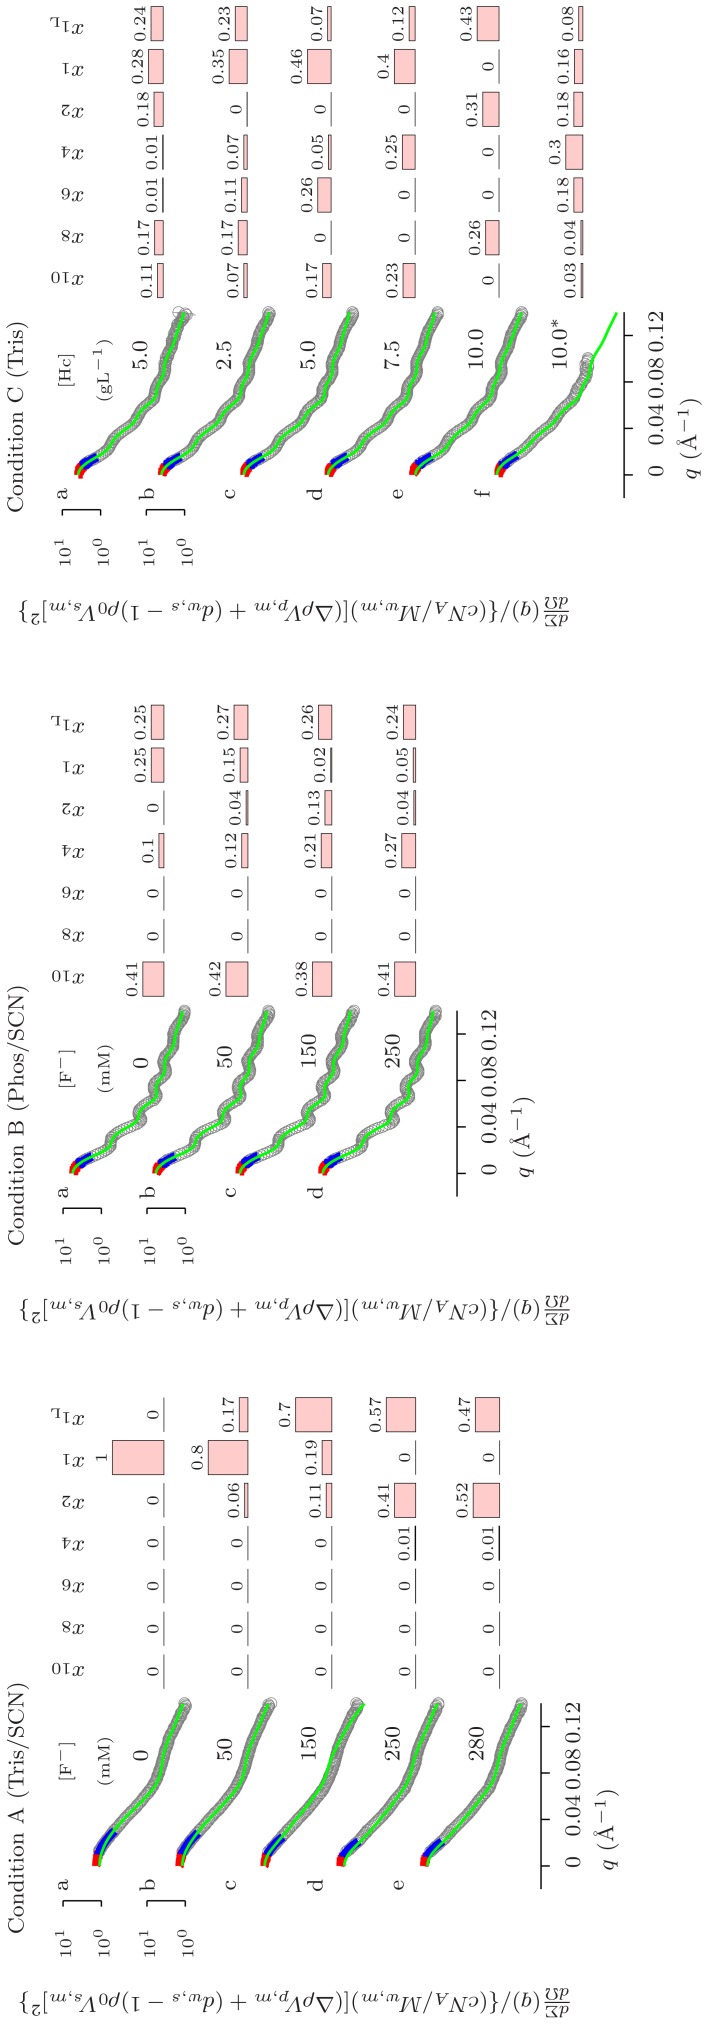
Figure 4. SAXS curves referring to Octopus vulgaris hemocyanin in Conditions A, B and C.
Condition A: hemocyanin 5.0 gL in 50 mM Tris/HCl pH 7.0 upon increasing F
 concentration in the presence of 100 mM SCN
 . Condition B: hemocyanin 5.0 gL
 in 50 mM phosphate pH 7.0 upon increasing F
 concentration in the presence of 100 mM SCN
 . Condition C: hemocyanin in 50 mM Tris/HCl pH 7.0 upon protein concentration increasing as indicated. The sample marked with (
 ) contains also 40 mM CaCl2. Results of the Guinier analysis for these conditions are reported in Table 1. See the caption of Fig. 1for more details.

