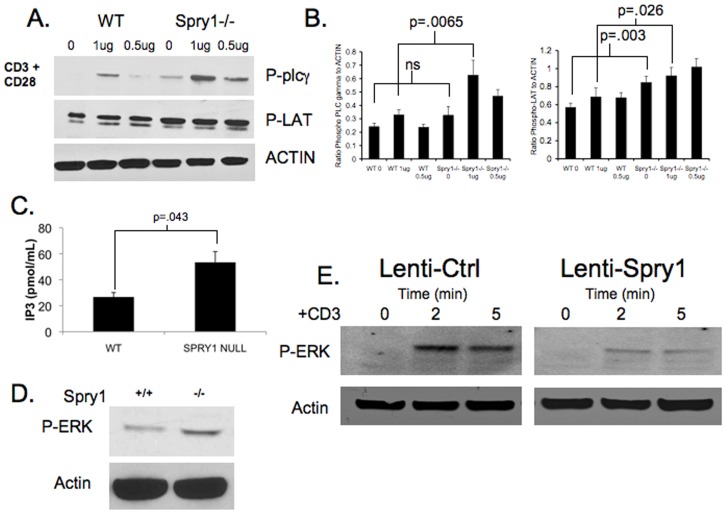
Figure 5. Spry1 null CD4+ T cells have enhanced TCR signaling.
A. Western blot analysis of PLC-γ and LAT phosphorylation in wild type and Spry1flox/flox Lck cre CD4+ T cells following ten-minute stimulation with anti-CD3 and anti-CD28. B. Graphical representation of Phospho-PLCγ and Phospho-LAT levels as measured by densitometry presented as ratio of signal to Actin levels. C. IP3 levels in wild type and Spry1 null CD4+ T cells following five-minute stimulation with anti-CD3. D. Western blot analysis of ERK phosphorylation in wild type and Spry1flox/flox Lck cre CD4+ T cells following 5 minute stimulation with anti-CD3. E. Western blot analysis of ERK phosphorylation in control vector or Spry1 overexpression vector transduced jurkat T cells following 2 and 5 minute stimulation with anti-CD3. Error bars represent one standard deviation of the mean. P values indicate statistical significance by student t-test. All experiments were performed at least three times. Data are representative of 3 mice per group.

