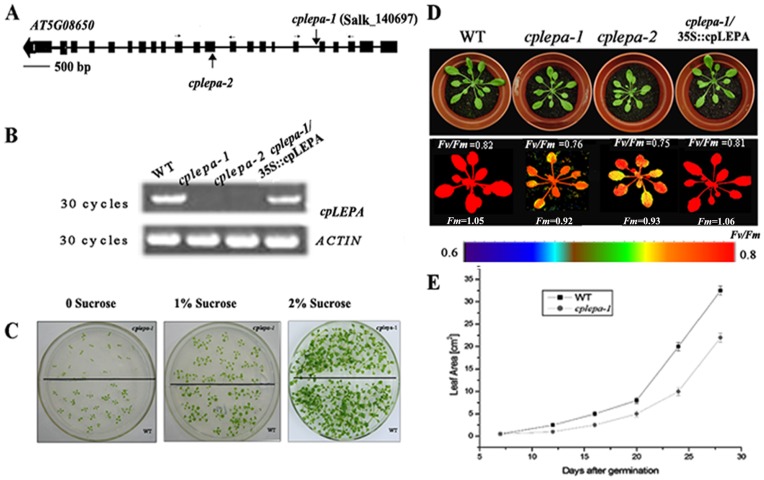
Figure 3. Identification and Phenotyping of the cplepa Mutants.
A: T-DNA insertion sites in the cpLEPA gene. Exons are indicated by black boxes, introns by lines, and the T-DNA insertions by vertical arrows. The horizontal arrows illustrate the primers used for T-DNA insertion verification and RT-PCR. The scale bar indicates 500 bp. B: RT-PCR analysis. RT-PCR was performed using specific primers for cpLEPA or ACTIN. C: Two-week-old WT and cplepa-1 mutants grown on MS medium supplied with 0, 1% sucrose and 2% sucrose. D: Complementation of the cplepa-1 mutant. The cDNA of the cpLEPA gene was cloned into a binary plant transformation vector and used for complementation of the cplepa-1 mutant (cplepa-1/35S::cpLEPA). Four-week-old WT, cplepa-1, cplepa-2 and cplepa-1/35S::cpLEPA plants were grown on soil. Fluorescence was measured with a CF Imager and visualized using a pseudocolor index, as indicated at the bottom, Fm and Fv/Fm value were presented. E: Growth of wild-type and cplepa-1 mutant plants on soil at 120 µmol m−2 s−1. The values shown are averages ± s.e. (n = 6).

