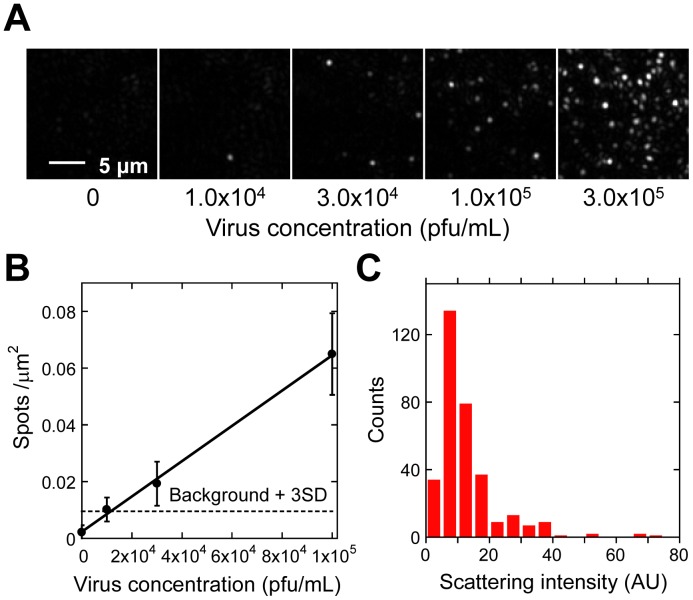
Figure 2. Dependence of spot density on the virus concentration as observed by TIRDFM.
(A) Scattering image of viral particles at different concentrations. The virus concentrations were 0, 1.0×10⁴, 3.0×10⁴, 1.0×10⁵, and 3.0×10⁵ pfu/mL. (B) Spot density plotted against virus concentration. The LOD was found to be 1.2×10⁴ pfu/mL. (C) Distribution of the intensity of scattering spots.

