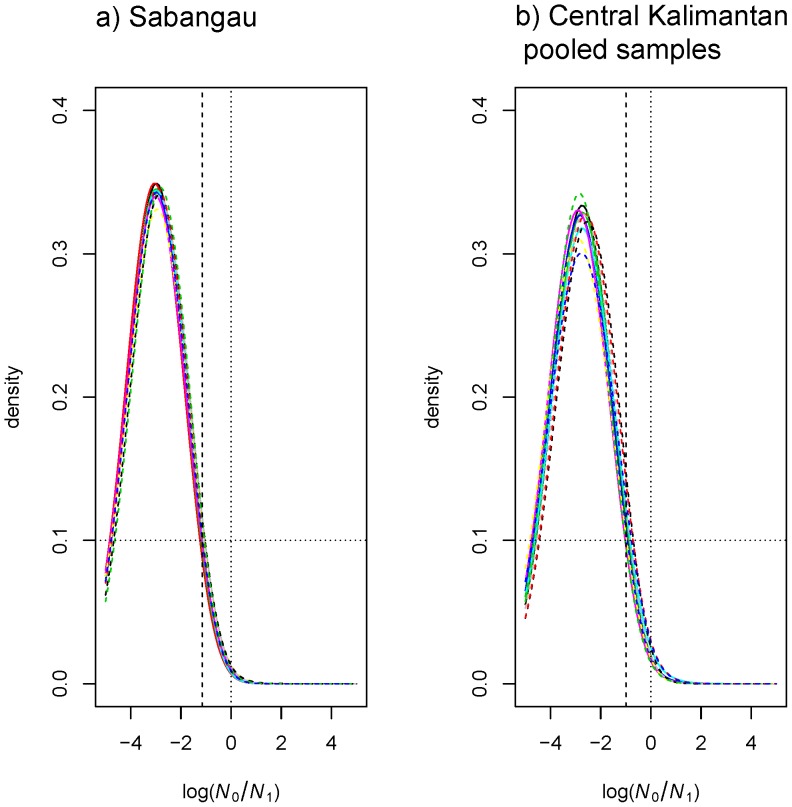
Figure 2. Demographic collapse detected using MSVAR 0.4.
Posterior distributions of the effective population size change, log (N 0/N 1). This is shown here for one of the investigated site (Sabangau) in Central Kalimantan and pooled samples analyses from the same region. Note that for illustrative purposes only two plots are shown (see Figure S1 for the other regions). Solid lines (multiple independent runs) correspond to the linear population size change model. Dashed lines (multiple independent runs) correspond to the exponential population size model. Log (N 0/N 1) represents the ratio of present (N 0) to past (N 1) population size. The dotted vertical line corresponds to the absence of population size change, log (N 0/N 1) = 0. The prior distribution is shown for comparison (flat dotted line). The vertical dashed line corresponds to the 95% quantile of the posterior distribution.

