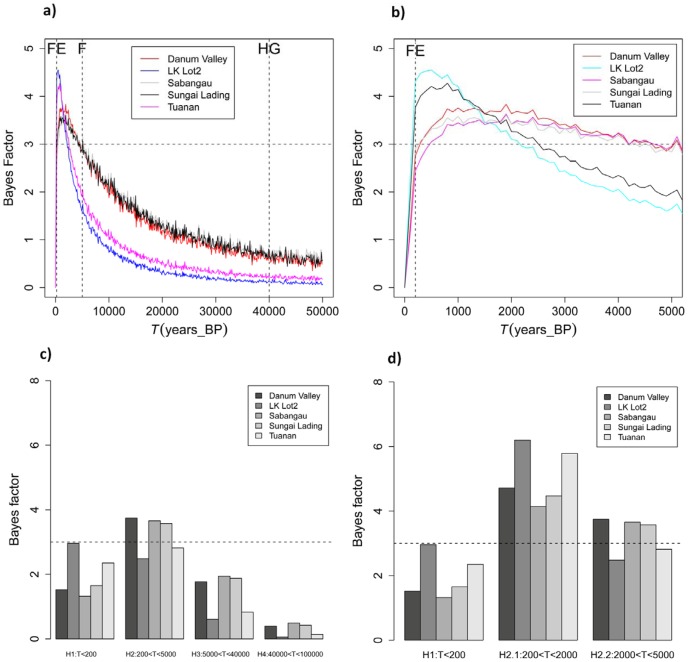
Figure 5. Test of the most likely period associated with orang-utan population decline.
Natural logarithms of the Bayes Factors (BF) have been computed to determine during which of the important phases the populations started to decrease. a) The BF values of parameter T (time since the beginning of the population collapse) for all orang-utan populations were computed for each 500 year time steps and are plotted for last 50,000 years. The BF value of 3 is plotted as horizontal dash line. The vertical dash lines corresponds to the dates of forest exploitation (FE) ∼ 0.2 kya, arrival of first farmers (F) ∼ 5 kya, and arrival of hunter gatherers (HG) ∼ 40 kya. Note that LK Lot2 is Lower Kinabatangan Lot2 population. b) As 5a), and plotted for the last 5 kya. c) H1 to H4 represents four different hypotheses tested, each corresponding to one of the four factors and time periods that may have led to orang-utan population collapse (discussed in the text). Phase H4 is most ancient and corresponds to time period between 100–40 kya (before the arrival of hunter gatherers (HG) and the time when major climatic and vegetational changes associated with the Pleistocene glaciations occurred). Phase H3 corresponds to the time period after the arrival of HG. Phase H2 corresponds to the time period after the arrival of first farmers (F) and before recent forest exploitation (FE) occurred. Phase H1 is most recent and corresponds to time period of the last 200 years when major forest exploitation occurred in Borneo. Thus, the BF represents the weighted evidence in favor of each phase against the cumulative evidence of all other phases taken together. The dashed horizontal line corresponds to a BF of 3, suggesting that phase H2 has more support than H1, H3, and H4 (see results). d) H2 phase (5,000 years from present) has been divided into two periods: H2.1 and H2.2 which corresponds to the time period just before the recent forest exploitation and after the arrival of the first farmers. The dashed horizontal line corresponds to a BF of 3 and suggesting that phase H2.1 has more support than H1 and H2.2.

