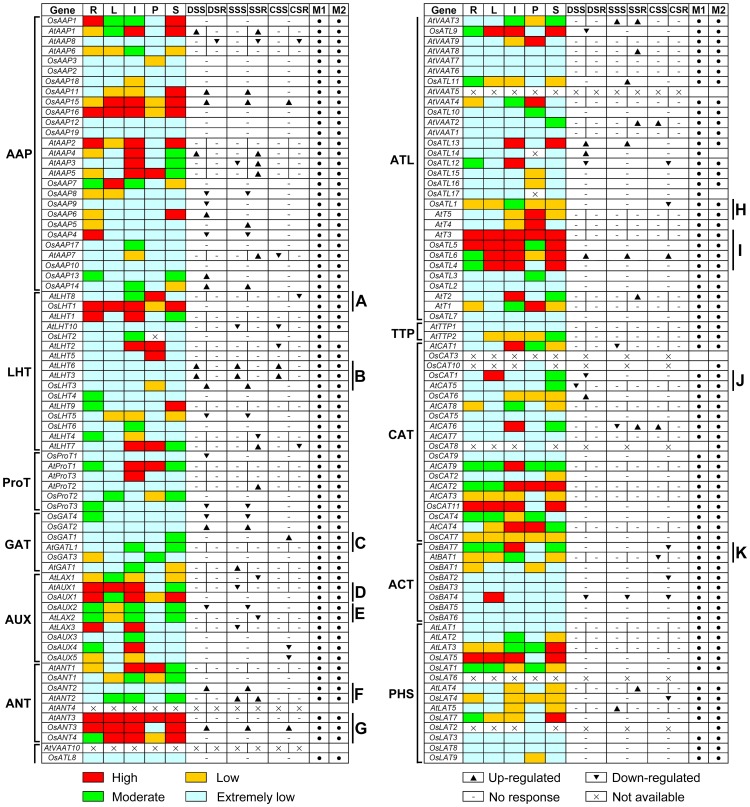
Figure 7. Expression comparison between rice and Arabidopsis AAT genes in different organs and under abiotic stresses.
The OsAAT and AtAAT genes are displayed according to the order in the corresponding phylogenetic tree (Figure S5). The expression data of OsAAT genes in different organs are combined from microarrays (M1) and MPSS (M2). In microarrays and MPSS data, red, green, yellow and light blue boxes indicate high (more than 2, 300 tpm), moderate (between 1 and 2, between 50 and 300 tpm), low (between 0.5 and 1, the signature numbers between 0 and 50 tpm), and extremely low (less than 0.5, no signature) expression levels, respectively. The symbol “×” represents no probe or signature on microarray and MPSS. “▴”, “▾” and “-” represent expression values that are evidently higher(>2), lower(<0.5) and no evident difference(0.5-2) under abiotic stresses compared to the control, respectively. (A) and (B-K) Showing homologous genes with distinct and similar expression patterns, respectively. R, root; L, leaf; I, inflorescence; P, pollen; S, silique (Arabidopsis) or seed (Rice); DSS and DSR; drought stressed shoot and root; SSS and SSR, salt stressed shoot and root; CSS and CSR, cold stressed shoot and root.

